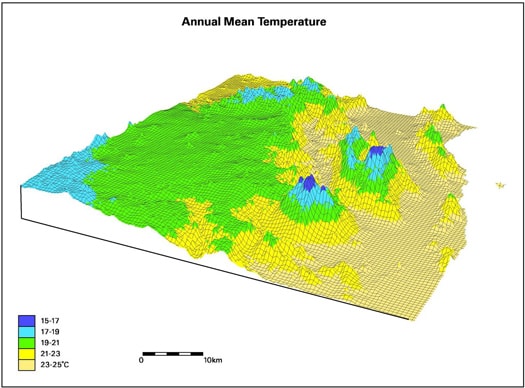
Some of the work e-MAST is carrying out involves interpolating climate from weather stations to high-resolution grids. This process is illustrated here with annual mean temperature, interpolated on to a digital elevation model for north-east Queensland. The mountains in the foreground are Mt Bartle Frere (1,622 m, front) and Mt Bellenden Ker (1,593 m, rear).

One of TERN’s newest facilities, Ecosystem Modelling and Scaling infrastructure (e-MAST) is leading the world to fill a gap in ecosystem modelling that will vastly improve the predictions scientists make about the ways in which climate change might be manifested.
As e-MAST’s work focuses on synthesis and applications of data, rather than the data collection of most other TERN facilities, it involves a relatively small group of institutions with complementary areas of specialty. Much of the data e-MAST uses are being assembled by other TERN facilities: the datasets being produced by OzFlux, AusCover and the Multi-Scale Plot Network are particularly important.
And, in an exciting break in the 40-year-old tradition of modelling terrestrial ecosystems, e-MAST is also bringing in data that are not traditionally associated with ecosystems.
Facility Director Professor Colin Prentice, who has been a pioneer of global vegetation modelling, said the new sources were ‘highly relevant’ to testing and improving ecosystem models.
‘One source of these different kinds of data is CSIRO Marine and Atmospheric Research, which is giving us measurements of carbon dioxide concentration (as opposed to flux) taken at Cape Grim and elsewhere. They are so precise that they do far more than just document the continuing rise of carbon dioxide concentration in the atmosphere. Although carbon dioxide is well mixed, the mixing doesn’t happen instantaneously, and so there are strong regional differences in the seasonal and inter-annual patterns of variation. These can provide information about the source-sink balance of ecosystems across a large region. And the land ‘signal’ dominates, because seasonal variations in marine ecosystem activity are buffered by the carbonate system in the ocean. So, provided that an atmospheric transport model is used to mediate between an ecosystem model and the measurements, they should provide information that is unique — an integrated view of the carbon balance of the whole continent.’
E-MAST will also use streamflow (or hydrograph) measurements made by many agencies and collected by CSIRO Land and Water.
‘We don’t usually think of stream flow as an ecosystem property. But it is, because the water that flows down streams and into rivers is (approximately) the water that is not consumed by terrestrial ecosystems,’ Colin says. ‘And at least the transpiration component of this water consumption is strongly regulated by plants. Stream flow is a rather sensitive test of an ecosystem model because a small proportional error in modelled water losses from ecosystems can translate into a much larger proportional error in stream flow. Provided a river-routing model is used to route the run-off from ecosystems down the actual transport pathways of water, stream-flow data from unimpaired catchments can be used as a test of how well models are simulating the coupling between carbon and water cycling through plants.’
OzFlux will contribute flux tower measurements of carbon dioxide and latent heat exchanges between ecosystems and the atmosphere, AusCover will provide satellite remote-sensing data on green vegetation cover, surface temperature and other land surface properties, and the Multi-Scale Plot Network will provide ground-level vegetation composition, structure and density observations across the country. In time, e-MAST will also benefit from Eco-informatics data, supplied by ÆKOS, and better soils information, supplied by the Soils facility.
E-MAST is ‘mining’ other data sources, too. It is assembling a large database of quantitative leaf-level information (e.g. photosynthetic rates, elemental composition, leaf mass–area ratios) on Australian plants.
‘This information is important to the inner workings of ecosystem models and will provide an independent check on whether models are getting the right answer for the right reasons,’ Colin says.
There is a proposal to extend this collaboration to link it better with the data the Multi-Scale Plot Network is collecting.
In another project, e-MAST will assemble data from whole-ecosystem experiments, especially those that involve the manipulation of local atmospheric concentrations of carbon dioxide. Colin explains why: ‘These experiments provide information that cannot be obtained in any other way because the concentration of carbon dioxide shows only small variations across the world at any one time. Current models vary greatly in the way they model the physiological effects of carbon dioxide concentration – as opposed to the effects of climate – on carbon uptake and water loss by plants. The experimental data are needed to narrow down this variation.’
Importance of cutting-edge modelling
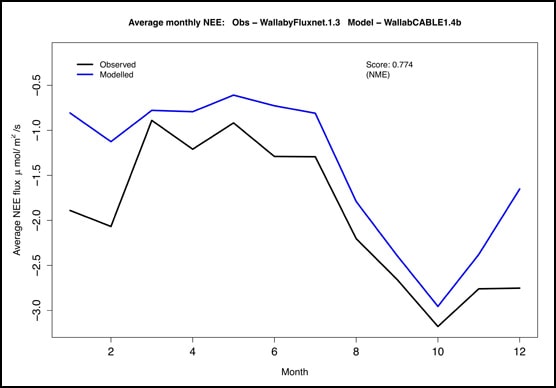
Colin said the value in e-MAST’s work was in using TERN data to systematically test and improve models so their potential is realised and they become truly practical tools.
’Today’s models are not very reliable,’ he says. ‘They tend to give very different estimates of present-day quantities such as carbon uptake by ecosystems, and alarmingly different predictions of the effects of changes in carbon dioxide concentration and climate during the 21st century.’
He said that terrestrial ecosystem scientists had been developing computer models of land processes for over 40 years, but often from a narrow perspective – for example, some models might deal just with vegetation composition, others just with productivity – and usually tailored to one ecosystem type. Climate modellers had also developed ‘land surface’ models. These were global in scope and described the exchanges of energy and water between the land and the atmosphere.
‘But they are traditionally static, with only a very limited ability to represent the effects of variability and change in climate on the composition and function of ecosystems,’ Colin says. ‘It’s only in only in the last decade that land models have developed to include coupling between processes on various time and space scales, from the hourly or daily carbon fixation and water loss by plants all the way to long-term, climate-driven changes in the geographic patterns of ecosystems across a continent.’
Recently, there has also been a huge expansion in data collection, so now models can be properly tested and refined with many kinds of measurements on the ground and from satellites.
‘This presents big opportunities to make models more reliable by using all of the different data types to test, and improve, them. But modellers all over the world have been slow to take up this challenge, because it isn’t easy. Data come in many flavours, from many different sources, with different formats and time steps and spatial resolution,’ Colin says.
This is the environment that e-MAST has stepped into.
Questions that can only be answered with the help of models
Reliable computer models are needed, increasingly, to combine measurements of different sorts and answer questions in the real world.
‘We need to use computer models because the calculation of reliable and realistic answers is so complex,’ Colin says. ‘And these days models have to be able to work at different scales. Questions could be posed at the spatial scale of a hill slope, or a whole continent, or anything in between.’
Different types of users would ask questions at different scales. The questions involve the same land processes, albeit from different perspectives, so they should be addressed using the same models. For example, a land manager might ask:
- How much extra carbon could be stored in this parcel of land if it were replanted with trees?
- How would that change the risk of fires, water supplies, and biodiversity here?
- Would the forest be sustainable for 50 years or 100 years, given likely changes in climate?
On the other hand, a government department might ask:
- How much carbon is being taken up each year by all of Australia’s ecosystems, and what fraction of that carbon is being stored long term?
- If carbon farming were practised on a large scale, what would be the benefits and trade-offs: for example, how much carbon could be stored, and would the amount stored reduce regional water supplies, and if so by how much?
- What are climate changes likely to mean for different forms of land use in different areas, and what are the best ways to conserve species given that their habitat ranges will be different in future?
Colin says: ‘The models should have been tested to the limit, and with all of the available measurements, whether they be “point measurements”, such as those from flux towers, or spatially extensive measurements, such as green vegetation cover mapped by satellites, stream-flow measurements, or carbon dioxide concentration variations.
‘Hence the “scaling” in the facility’s name. Scaling can be “up” or “down”. Models can perform up-scaling, meaning that they can use specific site measurements to optimise the model, and then apply the model to a region or continent. And they can perform down-scaling, meaning that they can take data from, for example, climate stations and remotely sensed elevations, and combine them to generate estimates of primary production and carbon storage potential at a high spatial resolution, potentially as high as the best satellite-derived “digital elevation model”, which is currently 250 metres.’
However, current ‘off the shelf’ models hadn’t been tested and improved in this way – at least, not so that modellers could compare their models with all sorts of data at the same time.
‘That’s why e-MAST is assembling data sets and developing software that will make it straightforward for a model to be “exercised” over recent years (driven by climate data supplied by the Bureau of Meteorology) and tested, and then progressively improved, against all of the relevant measurements,’ Colin says.
‘This is a world-leading effort, made possible through the sharing of data and the collaboration of different scientific communities that are the hallmarks of TERN.’
The partnership
Colin leads the scaling and modelling facility from his base at Macquarie University. Also involved are his colleagues Dr Belinda Medlyn and Dr Ian Wright who bring expertise on plant ecophysiology and plant functional traits to e-MAST. Professor Mike Hutchinson at the Australian National University developed the leading methods for topographic downscaling of climate data. The ANU plays an additional role through Dr Ben Evans and the National Computational Infrastructure, which will host the e-MAST data and software. CSIRO Marine and Atmospheric Research is represented by Dr Helen Cleugh’s laboratory, which is a leading player in developing and testing the CABLE model and has pioneered methods to combine different ecological and hydrological data to constrain ecosystem and water resources models. Professor Damian Barrett, who has recently returned to CSIRO Land and Water while retaining an affiliation at The University of Queensland, is an expert on data-assimilation techniques, which are algorithms to optimise variables and parameters in models with the help of independent observations from different sources. CSIRO subcontracts Dr Gab Abramowitz at the University of New South Wales, who has developed the Protocol for the Analysis of Land Surface models (PALS) which will form the initial basis for the e-MAST data-model interface software.
The facility benefits from synergies with activities funded in other ways. These include direct CSIRO support for modelling, Department of Climate Change and Energy Efficiency support for climate data downscaling at ANU, a fast-track Australian National Data Service project on near real-time monitoring of primary production (led by Macquarie University), an $88,000 cash contribution by Macquarie, and a substantial in-kind provision of computational resources by the NCI.
E-MAST has been funded through the Education Investment Fund since August 2011. Now that planning and initial data assembly are complete, work is gathering momentum and it is expected that the compilation of data sets will be complete, and a basic software infrastructure in place, by mid-2013.