In January 2013, ex-Tropical Cyclone Oswald and an associated monsoon trough passed over parts of Queensland and New South Wales, causing severe storms, flooding and tornadoes. Less than two months later, coastal areas again faced major erosion and minor flooding when severe storms and king tides hit.
In a land characterised by such regular extreme events, TERN’s Australian Coastal Ecosystems Facility (ACEF) is helping coastal communities and managers improve their understanding of these events by providing national landscape monitoring infrastructure for coastal ecosystem science.
ACEF is partnering with state governments, local councils, the CSIRO, the Australian Ocean Data Network (AODN), Integrated Marine Observing System (IMOS), the Australian National Data Service (ANDS), the Atlas of Living Australia (ALA) and with other TERN facilities, such as the Australian SuperSite Network, to collect and facilitate open access to coastal ecosystem data for use in policy, planning and management decision-making about extreme events on coasts.
To collect data on floods, storm surges and king tides, among other extreme conditions, ACEF uses high-frequency sensors and cameras to measure variables of river flow, water levels, sediments and nutrients in the water, salinity, waves, and coastal inundation. The data collected provides scientists with the means to develop a rich understanding of the impacts of extreme events, and can be incorporated into models that may be used by alert systems to help protect infrastructure, people and livelihoods by warning people to take early preventative action.
During the 2011 and 2013 floods in south-east Queensland it was this equipment that helped people calculate that up to 12.77 million cubic metres – 18 million trailer loads – of sediment were washed off the land into streams and rivers and deposited into Moreton Bay.
.jpg)
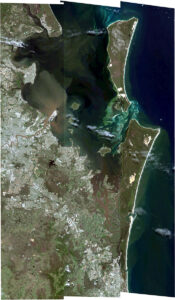
A composite satellite image of Moreton Bay on 3 February 2013, showing floodwaters from rivers including the Brisbane, Logan and Albert spreading into Moreton Bay (Image courtesy of Chris Roelfsema)
The impacts of nutrient-rich floodwaters and sediment deposits on ecological systems can be both beneficial and detrimental. The nutrients contained in the sediment nourish coastal systems but too much sediment, or toxins and other contaminants carried in the water, can harm aquatic ecosystems.
To help understand these dynamics, a TERN, CSIRO and ANDS project will use infrastructure delivered through the ANDS-funded SEQuITOR program to explore and visualise the effects of the 2013 south-east Queensland floods across the Logan and Albert catchments and Moreton Bay. The project will combine flood animations, conceptual diagrams, maps and, possibly, gaming technology to create visualisation tools that will aid in solving specific scientific and management questions.
Further south, where Gold Coast and Sydney residents are all too aware of the effects of wild weather and king tides on coastal ecosystems and property, ACEF is helping to monitor our coastline and beaches. Here and in about 50 other locations around Australia, ACEF has partnered with CoastalCOMS to provide access to video footage to monitor coastal erosion associated with king tides and high-surf events.
In addition to capturing footage of extreme coastal events, raw data from 17 of the cameras – accessible via the ACEF/CoastalCOMS data portal – is used to calculate detailed shoreline position and wave characteristics. This can be used to study the changes in shorelines such as at Surfers Paradise before and after severe coastal erosion occurred in early 2013.
Come and hear more from the ACEF team at our ‘Science of extreme events’ public briefing in Canberra on 10 February.
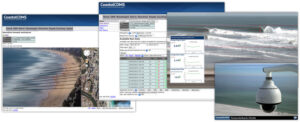

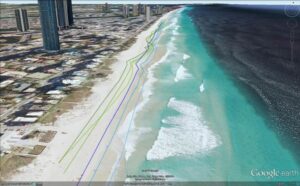
ACEF uses the raw data from 17 of the cameras in the CoastalCOMS monitoring network to undertake detailed shoreline and wave analyses (above). Shoreline analysis data at Surfers Paradise highlight the major changes between November 2012 (blue lines) and February 2013 (green lines) during an extreme coastal event (below). The various shades of blue and green lines represent low-, mid- and high-tide means (Imagery courtesy of Google Earth).
Published in TERN eNewsletter January 2014