With climate change intensifying drought conditions worldwide, a new early detection system for vegetation drought stress, developed by CSIRO and supported by TERN, could help farmers make crucial irrigation decisions, assist fire management authorities in preparing for high-risk periods, and enable governments to implement drought relief measures before conditions become catastrophic.
When Australia’s devastating “Tinderbox Drought” gripped southeast Australia from 2017 to 2019, it set the stage for the catastrophic Black Summer bushfires. These burnt large areas of forested ecosystems causing the death of millions of animals and resulted in the loss of human life and property, and reduced air quality over much of southeastern Australia. The occurrence of rapid drought intensification during this time exacerbated the impact on vegetation and drastically increased fire risk in the lead up to the bushfires.
Now, an international team of scientists led by CSIRO Environment, partly supported by TERN, has developed a groundbreaking method that can provide early warning of vegetation drought stress more effectively over traditional methods up to three months in advance. The research demonstrates how Japan’s Himawari-8 weather satellite observations of land surface temperature, coupled with hourly grids of air temperature based on Bureau of Meteorology (BoM) observations, enabled early detection of vegetation drought stress using a simple but powerful approach: identifying anomalies in the difference between surface and air temperatures.
The Challenge of Detecting Droughts in Real Time
As droughts increase in frequency and intensity, being able to monitor and forecast their impact on vegetation stress in near real-time becomes more important. Increasing stress levels of vegetation results in agricultural production losses, destabilises ecosystems and increases vegetation flammability, which means fires are easier to start and more difficult to control.
Early warning of vegetation droughts could enable urgent deployment of drought-response efforts that help mitigate agricultural damage and/or wildfire risk. Traditionally, people rely on measures of landscape water availability, such as precipitation and soil moisture, to detect drying signals in terrestrial ecosystems. Nevertheless, these traditional water availability metrics can miss detecting vegetation stress due to drought conditions, says Tim McVicar, who leads the Biophysical Dynamics Team in the Living Landscapes Program at CSIRO Environment.

“Generally, for much of Australia plants grow wherever water is available, but that doesn’t necessarily align with where rainfall occurs, because the water might fall as precipitation in one location yet accumulate somewhere else such as in Cooper Creek and channel country where lateral water flow and extensive flooding are dominant processes,” Tim says.
Measuring vegetation greenness is more ecosystem-specific and provides insight into leaf abundance and health. A decline in canopy greenness can signal vegetation stress over time, but it doesn’t convey clear signals of incipient plant stress during the early development of a drought, explains Dejun (Jack) Cai, an environmental spatio-temporal analyst working with Tim.
“Unfortunately, there is a time lag between when plants begin to experience drought stress and the observable changes in canopy greenness, such as yellowing leaves and/or reduced leaf area, which can require days to weeks to be visibly detected,” Jack says.
To find an earlier signal they turned their attention to the first thing most plants do in response to drought stress: they batten down the hatches via stomatal regulation to reduce water loss.
The Temperature Tell-Tale
Plants exchange gases with the surrounding atmosphere via microscopic pores called stomata. When stomata open, they allow carbon dioxide to enter and oxygen to be released. Plants also cool themselves by allowing water molecules to evaporate out through these tiny pores – much like how humans sweat. Of course, this only works well with sufficient access to water, says Tim.
“When a plant is happy, metaphorically speaking, there’s plenty of evaporation, which keeps the plant and the surrounding atmosphere moist and cool.”
“When we’re walking along, we can feel that,” he says. “For example, if you walk on plastic grass compared to real grass that’s been well watered, the plastic grass is much hotter under foot because it’s not evaporating.”
“When water stress begins, plants close their stomata to reduce water loss.”
When this happens, the plants also lose their evaporative cooling. Moreover, this occurs almost immediately in response to adverse conditions. Tim wondered if this early signal of vegetation drought stress could be detected using weather satellite data.
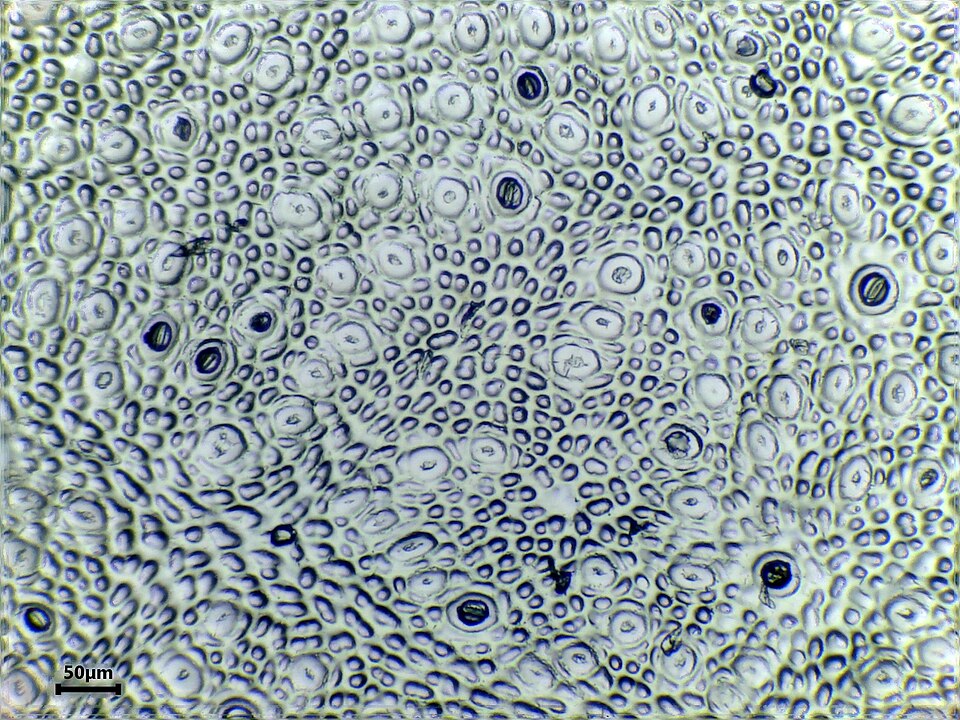
Although stomata are too small to be seen with the naked eye, Tim and his colleagues reasoned that stomatal behaviour could be monitored in an ecosystem by observing changes in temperature. They proposed that a satellite equipped with thermal infrared sensors that collect data numerous times per day should be able to detect rates of stomatal closure as a rise in land surface temperature at that location. They just needed data from the right satellite.
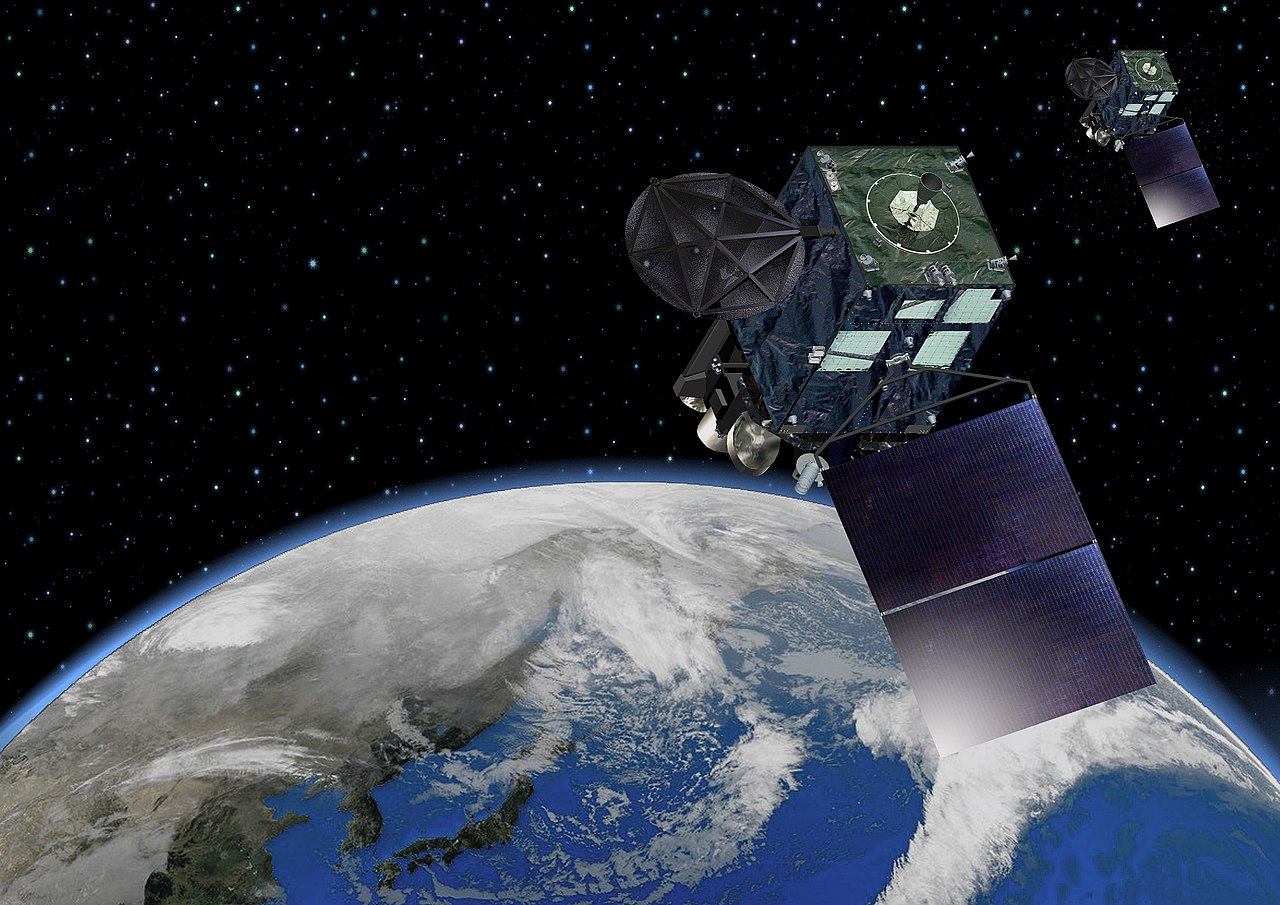
The answer was the Himawari-8 geostationary satellite, which sits 35,800 km above the equator at 140.7° East and acquires infrared remote sensing data over Asia and Oceania once every ten minutes. This allows sub-diurnal thermal dynamics to be monitored. Observations from Himawari-8 have been a valuable part of TERN’s Landscape Monitoring platform since 2015, making it possible for Tim and the team to easily access the data they needed.
They then compared the Himawari-8 satellite data with CSIRO-developed air temperature grids using publicly available air temperature data from hundreds of weather stations located all across Australia, operated by BoM. This enabled the team to create a continental grid of hourly air temperature observations at 1 km2 resolution. The method to generate these data, showing its higher accuracy over global and regional reanalysis outputs, is outlined in this Climate Dynamics paper. These data are currently available from the CSIRO Data Access Portal and will soon also be available via TERN’s Data Discovery Portal.
The CSIRO Environment team were now able to measure cumulative hourly differences in surface temperatures and air temperatures for each specific location and date, and pinpoint heat anomalies indicative of unusual stomatal behaviour. They called the new method SATDA: Surface-Air Temperature Difference Anomaly. They also knew exactly how they would test it.
Testing against Australia's Worst Drought
Australia’s Tinderbox Drought was characterised by cool season rainfall deficits of around 50% in 3 consecutive years over southeast Australia, which was exceptionally unlikely in the context of natural variability alone. This extreme event provided the perfect testing ground for the new vegetation drought stress detection method.
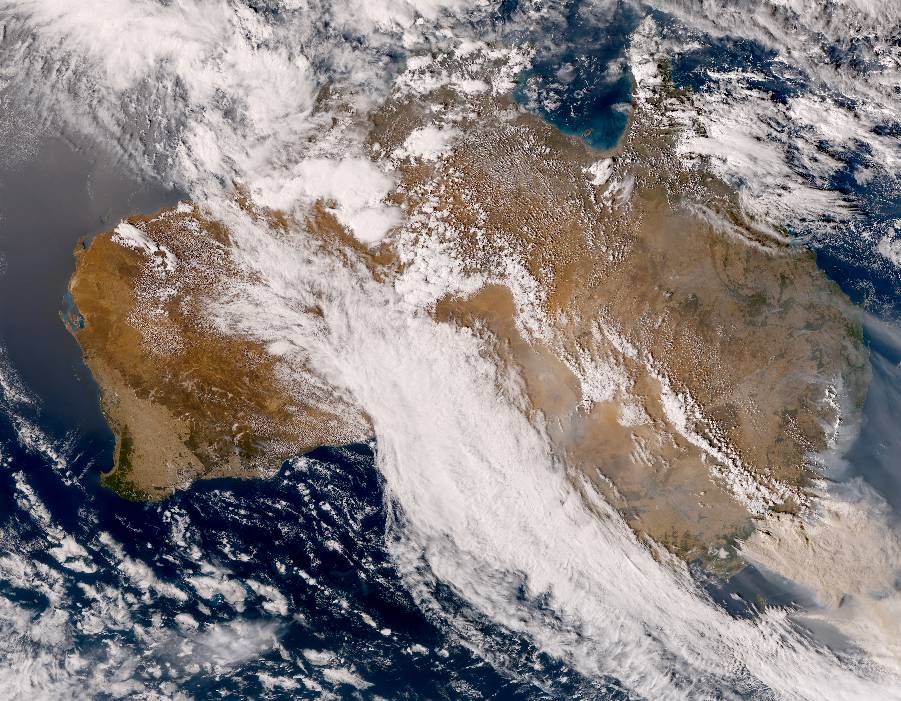
In collaboration with colleagues at Chiba University in Japan, and with additional support from TERN, the CSIRO team analysed Himawari-8 hourly land surface temperature data between late 2015 and 2022, focussing on the critical late-morning to early-afternoon period when surface minus air temperature differences are most pronounced if the vegetation and landscape are experiencing drought conditions. Their study covered southeast Australia, including the Murray Darling Basin.
“We mapped the whole region pixel by pixel,” says Jack. “We were able to see that by the middle of July 2017 it was beginning to get dry across central NSW, and by September it was really dry in southeast Queensland, as well. Once we got to May – July 2018 we observed pretty tough conditions, and by September 2019 much of the eastern seaboard is really dry.”
In other words, SATDA effectively captured the spatio-temporal dynamics of a profound multi-year drought event occurring across southeast Australia. An unexpected bonus to the researchers was that within the widespread, multi-year Tinderbox Drought, SATDA demonstrated the ability to track a rapid flash drought that occurred at multi-week timescales from July to September 2019 in northeastern NSW, which contributed to detrimental impacts on agricultural production and increased wildfire risk. The team recently published the SATDA method and their findings in Remote Sensing of Environment.
Early Warning Advantage
What makes this breakthrough particularly significant is its speed and accuracy. Jack, Tim and their colleagues showed that thermal infrared remote sensing can indeed provide rapid and accurate detection of vegetation drought stress. The insight it provides is informed by surface energy balance principles and reveals how plant stomata are behaving on an hourly basis in any ecosystem across Australia relative to how each ecosystem operates under ‘normal’ and ‘wet’ conditions.
Across southeast Australia, SATDA showed overall better performance in forecasting a decline in drought-induced vegetation greenness than traditional water availability indices such as precipitation and soil moisture. The most evident advantage of SATDA occurred in forests and woodlands, where the deep roots and complex physiological controls of trees make drought impacts harder to detect by traditional water availability-based methods alone. For forests in northeast NSW, SATDA provided effective forecasts of vegetation greenness anomalies up to 12 weeks in advance.
This early detection capability could transform how we prepare for and respond to vegetation drought stress, says Tim. “If you’re in a woody area and you want to know about rapid dryness and increased fire risk, SATDA can give you that information over a month out, and in some cases, up to 3 months.”
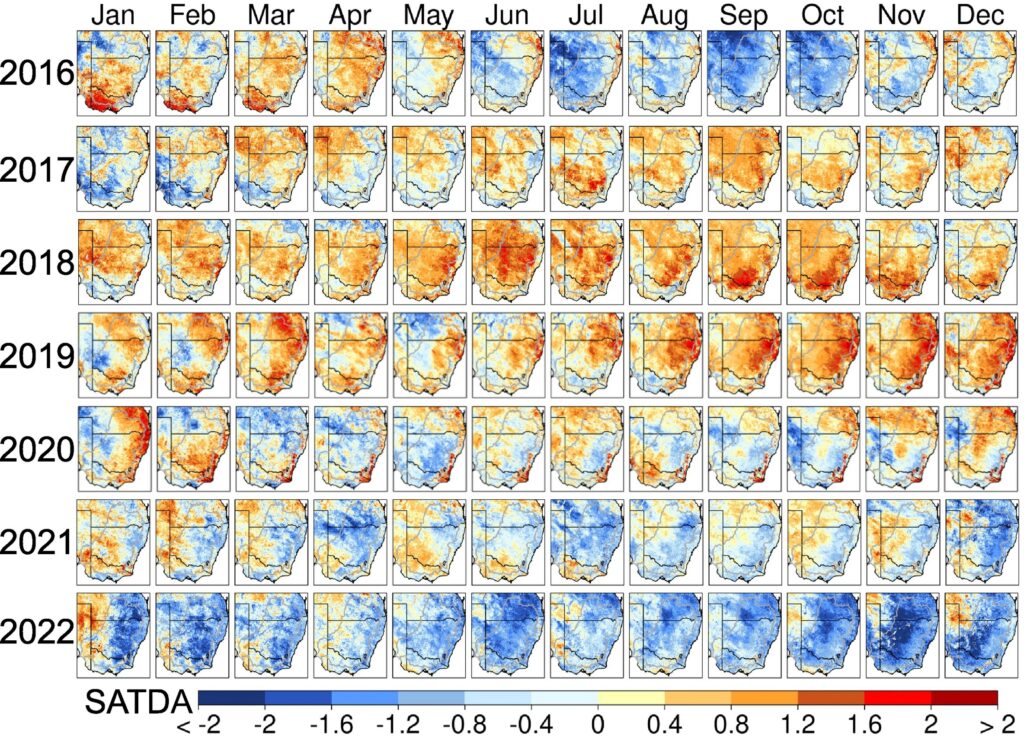
Side-by-side animations of the spatial and temporal dynamics of SATDA over southeast Australia during the Tinderbox Drought. On left: weekly time-lapse spatial dynamics; On right: weekly time series chart averaged across the Murray-Darling Basin (MDB) over the same period (source: Dejun ‘Jack’ Cai)
A Global Solution
The beauty of the SATDA method lies in its simplicity, efficiency, and global applicability. The SATDA method suits global-scale operational implementation to complement vegetation drought monitoring and early warning systems.
Unlike complex drought indices that require multiple data sources and sophisticated calculations, SATDA needs only two readily available pieces of information: (i) satellite-derived surface temperature; and (ii) meteorological air temperature data. This makes it particularly valuable for regions with limited ground-based monitoring infrastructure.
“We can now monitor vegetation stress while the vegetation is experiencing it,” says Jack. “With additional support to develop the engineering workflows, SATDA can be available to all users in near real-time” says Tim.
Looking Forward
With climate change intensifying drought conditions worldwide, early detection systems like SATDA could help farmers make crucial irrigation decisions, assist fire management authorities in preparing for high-risk periods, and enable governments to implement drought relief measures before conditions become catastrophic.
The CSIRO Environment research team has made its data and key scripts publicly available, paving the way for operational implementation of SATDA in drought monitoring systems worldwide. In our increasingly connected world, it seems that sometimes the best way to understand what’s happening on the ground is to look down from space.
Story feature image: Himawari-8 satellite (credit: Japan Meteorological Agency via Wikimedia Commons)