Australia’s environment had an above-average year in 2025, with good rainfall across much of the country, improving soils and vegetation, and progress in environmental management. However, climate change is inflicting serious and accelerating damage on marine ecosystems and driving more species toward extinction. Over the course of 2025 a further 39 species were added to Australia’s List of Threatened Species, bringing the total number of threatened species to 2,175.

Produced each year since 2015 through a collaboration between TERN and the Australian National University (ANU), the Australia’s Environment report is an account of the environmental trajectory of the nation, recording key events and challenges that define the Australian landscape and determine its future resilience.
Released on 24 March 2026, the Australia’s Environment 2025 report records a slight worsening of the nation’s environmental conditions compared to the previous year, with an Environmental Condition Score of 7.4 out of 10. Nevertheless, conditions were above average for the fifth consecutive year, indicative of a relatively healthy environment with vegetation conditions among the best on record and emissions falling despite economic and population growth.
Environmental condition scores improved in Queensland (rising from 7.7 to 8.3), South Australia (rising to 4.7) and Western Australia. These gains were offset by significant declines in the Northern Territory (from 8.7 to 6.5) and the ACT (from 7.2 to 5.5), Tasmania (from 6.1 to 5.1) and Victoria (from 6.1 to 4.9).
National Environment Indicators at a glance
Numbers represent the relative change from 2000–2024 average conditions. Such a change can be part of a long-term trend or be within normal variability. Details on each of the indicators shown below are provided in the report.
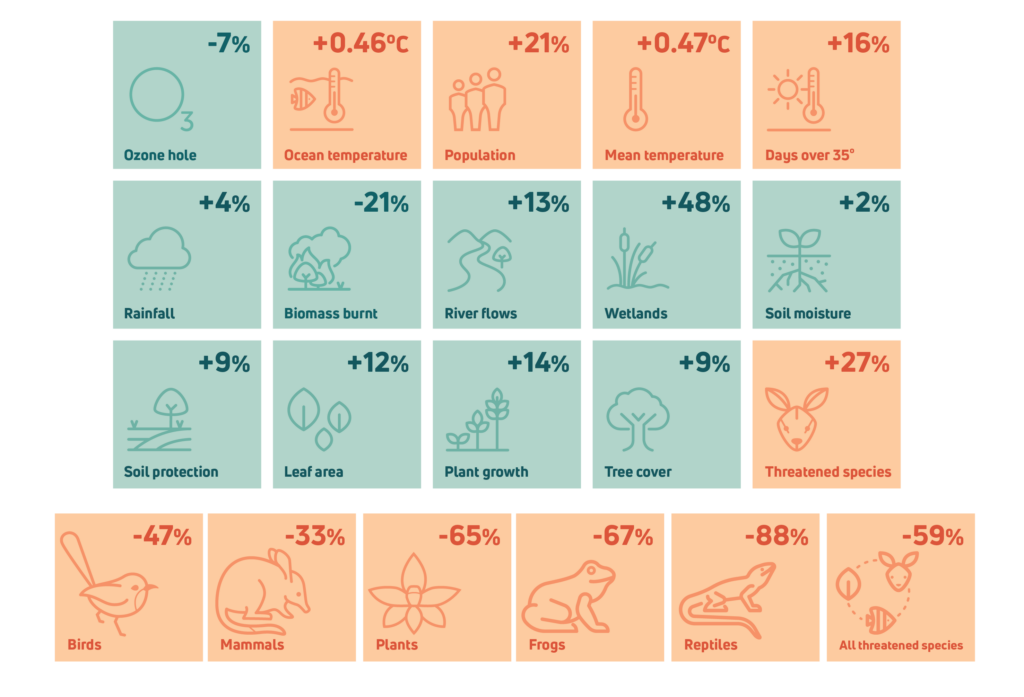
Change in abundance relative to 2000 (latest data are for 2022)
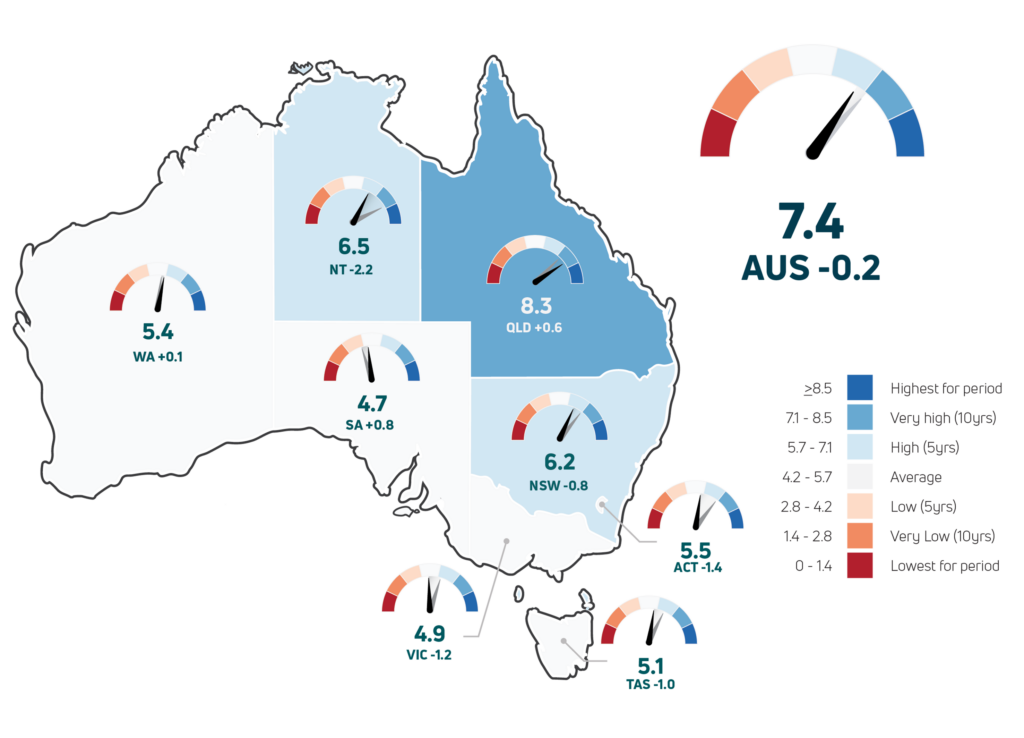
ECS by State and Territory and change from the previous year
A good year on land, but uneven
According to the Report, 2025 was characterised by above-average temperatures across Australia. The average temperature for the year was the fourth-highest on record. The continent experienced a wetter, greener north and east, and a dry south and west.
The year began with a notably dry January. Indeed, monsoon onset in Darwin did not occur until early February, which is the latest since records began in 1957. Despite the dry start to the year, national rainfall was above average in March, April, July and August, and again in November and December. This resulted in a national rainfall average for 2024 that was 4% higher than the 2000–2024 average.
This rainfall was not evenly distributed though. Parts of the Northern Territory and north-western Western Australia received above average rainfall, and Queensland experienced an exceptionally wet year, beginning with heavy monsoon rains along the coastal north which caused major flooding between Townsville and Cairns. In March, south-east Queensland and north-east NSW experienced major flooding due to Tropical Cyclone Alfred. In addition, high rainfall in central Queensland caused floodwaters to surge through the Channel Country river systems and led to the largest inundation of water into Kati Thanda–Lake Eyre in South Australia in least 15 years. This triggered a remarkable mass hatching of invertebrates, fish breeding and the arrival of waterbirds from across the continent.
While Australia’s north experienced one of its wettest years in decades, Australia’s southern regions endured a third year of low rainfall. In particular, South Australia experienced its driest year since 2019. The Report also provides a summary of the substantial impact of marine heatwaves fuelled by climate change in 2025.
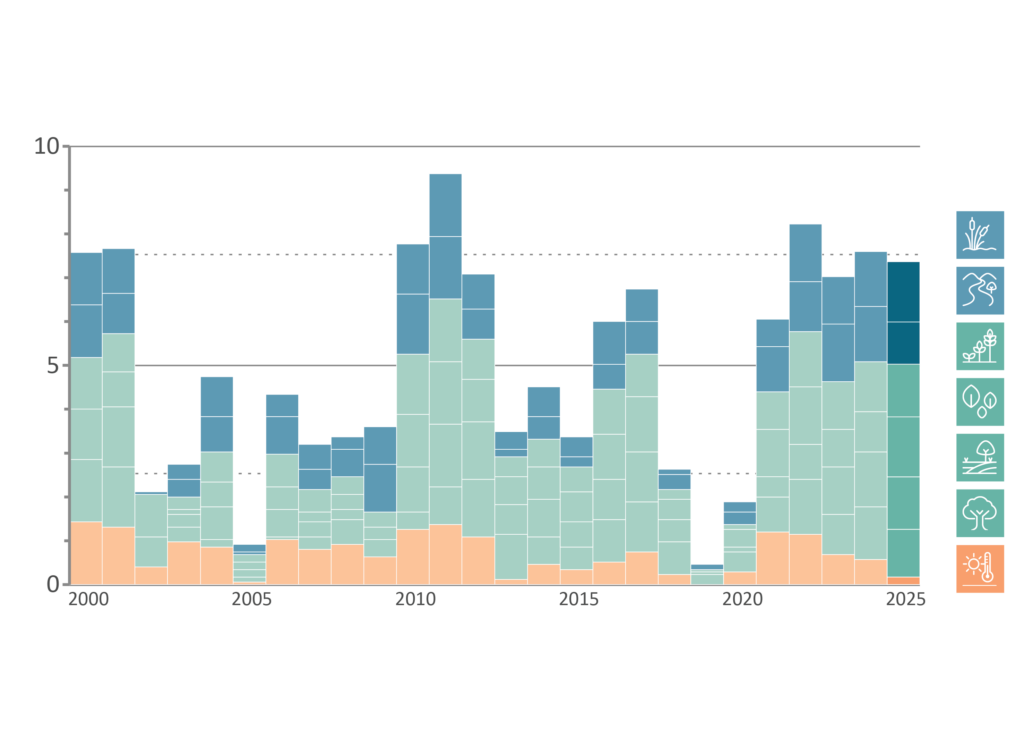
Summary Indicators: the Environmental Condition Score is a score between 0 and 10 expressing condition relative to previous years. It is calculated as the average rankings of component scores (from top to bottom in the bar graph): inundation, streamflow (blue), vegetation growth, leaf area, soil protection, tree cover (green) and the number of hot days (orange).
Australia’s biodiversity continues to decline
Australia’s Environment Report incorporates long-term monitoring data captured by TERN’s Threatened Species Index (TSX), which revealed ongoing declines for Australia’s flora and fauna.
In 2025, 39 species were added to the threatened species list, bringing the total to 2,175. This represents a 54% increase in the number of threatened species since 2000. Climate change is now a main threat to nine out of every ten newly listed species. Indeed, the impacts of the 2019-20 Black Summer bushfires continue to be felt and account for more than half of all species listed or uplisted since 2019.
“The extinction crisis is real, and it is worsening,” said lead author Professor Albert Van Dijk of the ANU Fenner School of Environment and Society. “And increasingly, climate change is the thread running through it — compounding habitat loss, interacting with invasive species, and intensifying fire. That’s what makes it so hard to tackle.”
The latest TSX data reveal that populations of threatened species are thinning. Populations of threatened birds, mammals, plants, frogs and reptiles have declined by an average of 59% since 2000. Reptiles and frogs have experienced the starkest declines during this period, declining by an average of 88% and 67%, respectively. Threatened plants follow close behind – they have declined an average of 65% since 2000.

Relative abundance of different categories of EPBC Act listed threatened species since 2000, as collated by the Threatened Species Index. The Index implements a 3-year lag, such that these trends go up to 2022
In encouraging news, threatened mammals populations showed signs of stabilisation in recent years, likely reflecting a combination of good rainfall and the measurable benefits of predator control and habitat restoration. This data again revealed that species protection and management can be an effective measure for slowing threatened species declines.
“Australia’s environment is not doomed — in many respects it is in better shape than it was a decade ago,” said Professor Van Dijk. “But climate change is the threat we don’t yet control, and decades of warming are already locked in. That means reducing emissions remains as urgent as ever.”
Australia’s greenhouse gas emissions fell by 1.9% in 2025 according the Report. This is particularly significant given this decline occurred while the economy grew by 2.6% and the population by 1.5%. It’s an important sign that economic activity and population growth are gradually being decoupled from environmental impact. In other notable progress, the 2025 data show that native forest loss has declined for five consecutive years while tree cover is increasing. Meanwhile, land clearing for grazing land and native forest logging continues to fall.
“We are slowly getting better at managing what’s within our control,” said Professor Van Dijk. “Emissions are falling, forest loss is declining, and with the abundant rains the land was in good shape across most of the country. These are real improvements. But the climate crisis has the potential to undo all that progress.”
“Managing our way through climate change will remain the defining environmental challenge of our time.”
Long-term data monitoring reveals the status of our environment
To produce the Australia’s Environment report and data explorer, ANU analyses vast amounts of long-term measurements from satellites, weather stations, river gauges and ecological surveys algorithms and prediction models, including many delivered by NCRIS-enabled projects, including TERN. The results allow patterns of change in Australia’s ecosystems to be assessed, which is critical to understanding and managing our environment. These results are summarised with a score between zero and ten, which provides a relative measure of how favourable conditions were for nature, agriculture and the Australian quality of life, compared to all years since 2000.
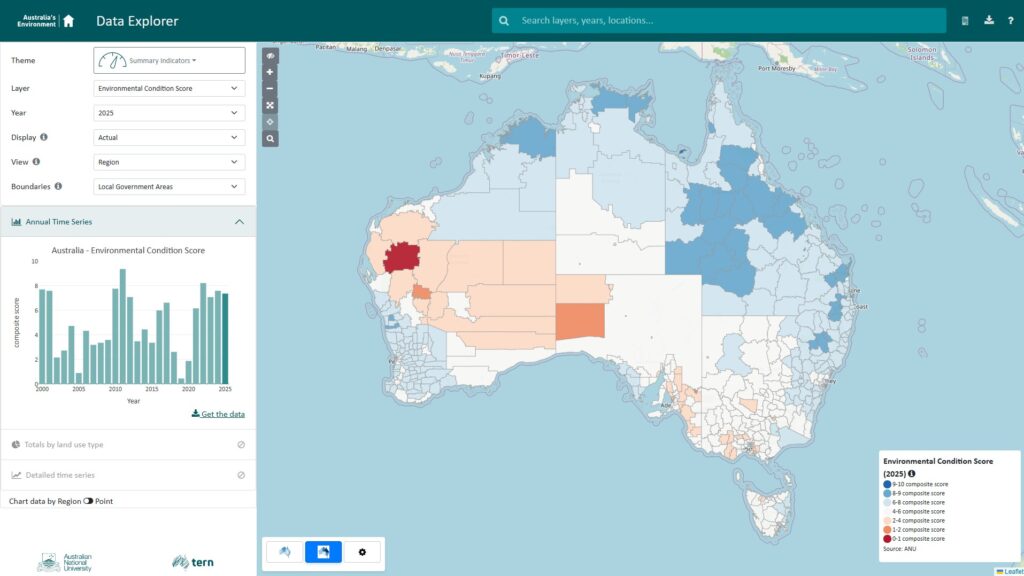
Conditions varied enormously by region this year, so for the first time we have calculated environmental condition scores right down to the suburb and locality level. This data has been made available so that anyone can look up the environmental status of their local area via the Data Explorer.
The Explorer aims to provide direct access to data summaries as maps, accounts and charts. Data can be examined by point location, region and landcover type, compared to preceding years, or downloaded for further analysis
Without the thousands of data sets gathered by citizen scientists, government, conservation and research groups and made available by TERN and its Threatened Species Index (TSX), Australia would be in the dark and unable to track the changes in abundance of its threatened and near-threatened species.
The Australia’s Environment report complements the Australian Government’s State of the Environment reporting, allowing researchers and managers to monitor and analyse trends in the years between government State of the Environment report releases.