Comprehensive nation-wide information on important soil and landscape attributes has been available via TERN’s Soil and Landscape Grid of Australia for six months now. Despite its infancy, The Grid has already been accessed over one hundred thousand (119372) times by researchers from 100 countries, who are now using the information in a huge range of ways. We take this opportunity to remind you of the wealth of soil and landscape information that’s currently at your fingertips; and have a sneak peek at some usage statistics to find out who’s been accessing what data.
 |
Easy access to nationally-consistent and comprehensive soil and landscape attribute data at a finer resolution than ever before was made possible last November thanks to the launch of the Soil and Landscape Grid of Australia. In just six months, The Grid has become an essential piece of national information infrastructure, required to support informed use and management of our soil and landscapes.
The Grid delivers a step-change in the way we can view and access the best available information about Australian soils and landscapes for a wide range of applications and users including urban and regional planners, land managers, farming groups, scientists and engineers.
The Grid makes the most of significant past investments in soils information by drawing hundreds of millions of dollars’ worth of historical data together with new data generated from sampling, laboratory sensing, modelling and remote sensing. It is the result of a significant national collaborative effort bringing together researchers from the CSIRO, the University of Sydney, Geoscience Australia and federal, state and territory government agencies.
Data available
The Soil and Landscape Grid provides data on soil and landscape attributes with estimates of uncertainty. Data are provided at 90-m pixels, and are available for six soil depths down to a maximum of 2 metres (0-5cm, 5-15cm, 15-30cm, 30-60cm, 60-100cm, 100-200cm). The data are consistent and comprehensive in easily accessible raster file formats that can be downloaded or viewed through an online portal. Attributes available are:
| Soil attributes | Landscape attributes | |
|
|
The Grid is a dynamic product, that can be enhanced and updated as new techniques and data become available over the years. This will ensure that, throughout time, the grid remains a useful and relevant resource for Australian soil information. The Grid is also contributing to global understanding and management of soil and landscapes, through its connection into the Global Soil Map project, in particular the Oceania Node of the project.
A snapshot of usage
Since its launch in late November 2014, The Grid has been viewed over one hundred thousand times. Users have downloaded over 3500 datasets on Australian soil samples and landscape attributes using the web services download mechanisms. Users are diverse and represent a wide range of sectors including industry, agriculture, mining, consulting, state and federal government and higher education.
The most-viewed maps include the soil attributes of Clay, Sand, Bulk Density, and Available Water Capacity.
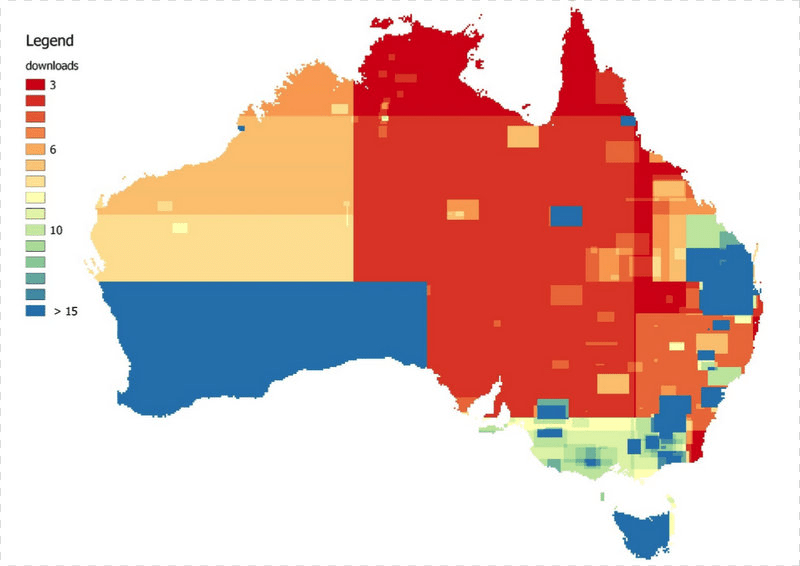
Areas for which data has been downloaded—blues and greens represent the most data downloads with reds and oranges indicating fewer downloads (data and graphic courtesy of CSIRO)
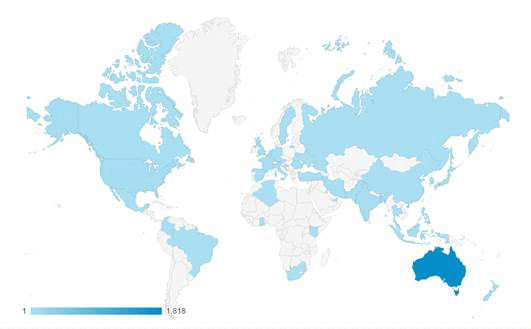
Users from a hundred countries around the world have viewed data from Soil and Landscape Grid of Australia—darker shades of blue indicate higher rates of access. As expected, the statistics show that the majority of grid users are Australia-based (89%), with users from the USA UK, Canada and New Zealand making up the top five (data and graphic courtesy of CSIRO).
- For more information on the Soil and Landscape Grid please contact Mike Grundy