A new study of Australia’s mangrove ecosystems over the past 30 years has found that they expanded between 1992 and 2010 but have been contracting since then. Read the key findings and openly access the first ever national maps of annual mangrove extent via TERN from 1987 to 2016.
A lot has changed since the 1980s—think the internet, phones, research data collection, etc—but what about Australia’s mangrove ecosystems and their ability to support faunal biodiversity, filter pollutants, protect marine ecosystems, reduce coastal erosion and storm damage, and store carbon?
Australia’s first national maps of annual mangrove extent
Dr Leo Lymburner of Geoscience Australia leads the team that has used satellite data from Digital Earth Australia (DEA) and maps from Global Mangrove Watch (GMW) to show the dynamics of Australia’s mangroves for a 30-year period leading up to the 2016 dieback event.
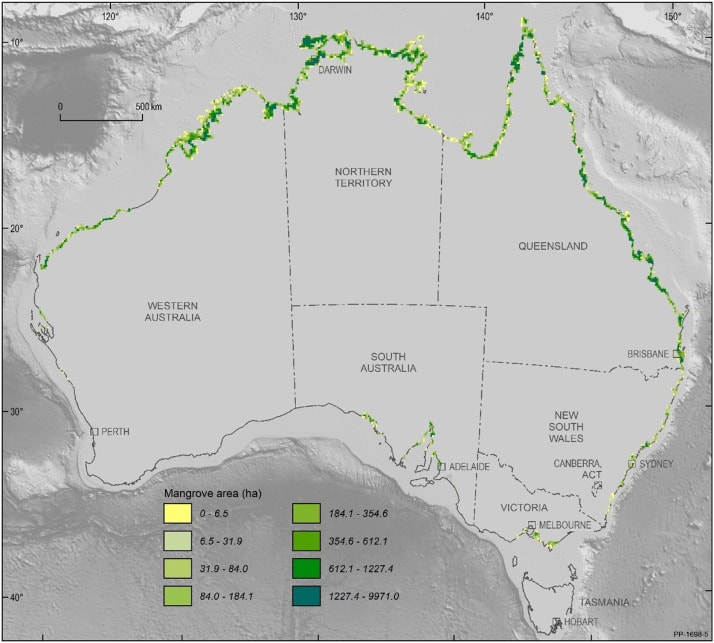
“By analysing Landsat estimates on fractional cover—a key measure of the area covered by green vegetation—we’ve been able to produce annual maps of mangrove extent at 25 metres resolution for all of Australia.”
These maps are the first to be generated at a continental scale on an annual basis, and are now openly available via TERN’s Mangrove Data Portal.
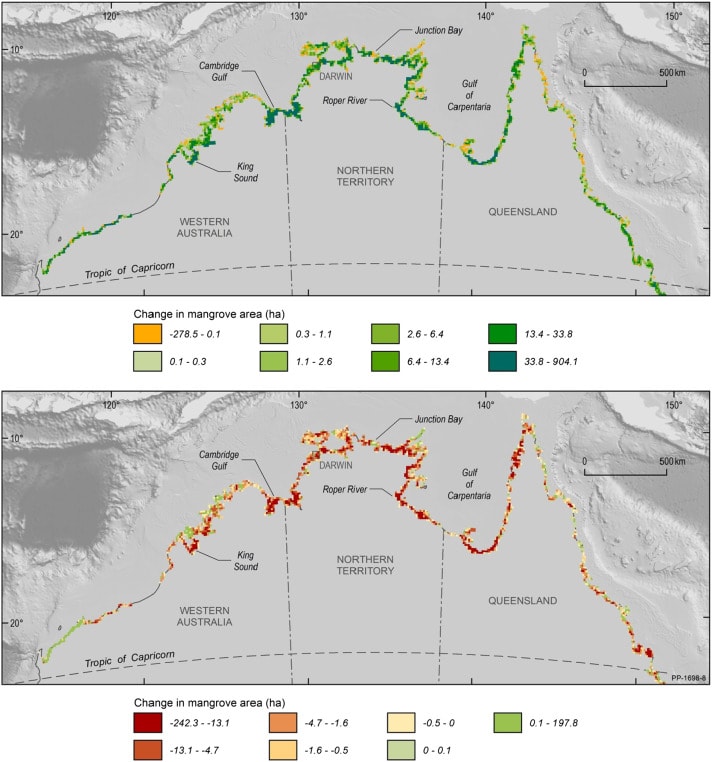
“The maps indicate that Australia’s mangroves expanded between 1992 and 2010 and contracted thereafter.”
The expansion of mangroves between 1994 and 2010 (top) and decreases in mangrove extent between 2010 and 2016 (bottom) (image courtesy of Lymburner et al 2019)
What’s causing mangrove change?
Mangrove ecosystems in Australia are protected by state, national and international legislation but are still highly vulnerable to adverse environmental change, says Leo’s fellow mangrove researcher Professor Richard Lucas of Aberystwyth University in Wales. Richard says that this research adds to the general understanding that dieback and regrowth of mangroves is likely to be cyclical and dependent on a number of climatic and oceanic factors.
“The majority of change occurred along the northern Australian coastline and was concentrated in the major gulfs and sound, while mangroves on the eastern and southern coasts remained comparatively stable.
Severe tropical cyclones led to a considerable loss of mangrove cover in the northern regions, but recovery was generally quite quick, in the range of five to six years.”
Richard says that mangrove ecosystems can also migrate geographically over time, with this largely occurring because of physical changes in the coastline. However, areas of mangroves which have remained in the same position over time have a higher conservation importance due to their role as long-term refugia during unfavourable climatic fluctuations.
More research using these maps is required, but it may be the case that mangroves will return to their 80s extent—perhaps in the same way that 1980s fashion statements such as the ruffles, metallic colors, shoulder pads and mullets have resurfaced in 2019!
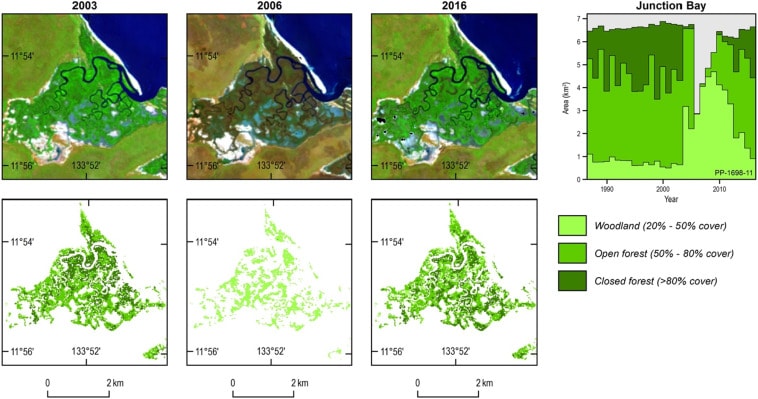
Junction Bay, Northern Territory, where mangroves experienced losses in extent and cover in 2003 and 2006 as a result of category 3 (severe tropical cyclone Debbie) and 5 (severe tropical cyclone Monica) tropical storms respectively. Note that the 2003 image is prior to the impact of Debbie. The column chart indicates the extent and cover during the pre- and post-cyclone periods. (image courtesy of Lymburner et al 2019)
Sustainable management with better information on environmental change
Work is ongoing for Leo and his colleagues, whose future efforts are focusing on the routine production of annual mangrove maps beyond 2019.
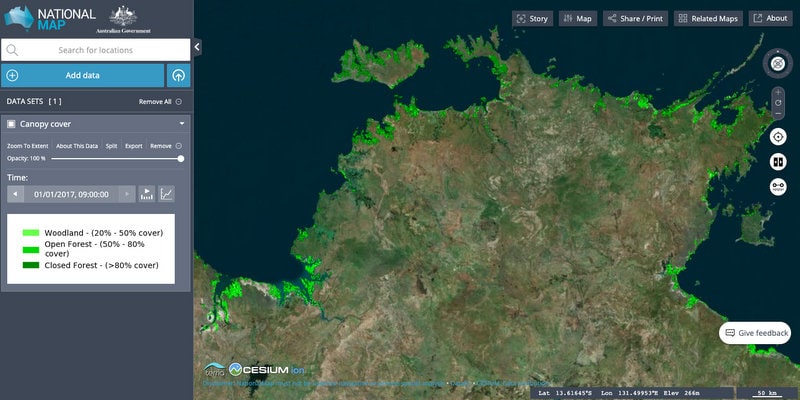
As new maps are created they will be made available through the Australia Government’s National Map and the TERN Mangrove Data Portal, which already provides open access to decades of historical and newly acquired field and Earth observation data.
The Australia State of the Environment 2016 report highlighted that there is a lack of coordinated national mangrove monitoring and evaluation of ecosystem function, productivity and condition. According to Professor Graciela Metternicht of the University of New South Wales, the nationally consistent mapping protocol that this project has established goes a long way towards filling this gap.
“A major benefit of the TERN Mangrove Portal is that a range of openly available datasets relevant to mangroves are provided to assist with the development of a monitoring system but also to support scientific research and their conservation, management and sustainable utilisation. National monitoring is considered essential, but there is also a need to better understand the ‘drivers’ of mangrove change and the associated pressures and impacts, particularly for informing decisions on suitable interventions, such as the restoration of affected areas and long-term protection of well-established ‘core’ areas.
Additionally, the TERN Mangrove Portal also assists policy development, the evaluation management actions and allows the nation to contribute to international environmental conventions, such as the Sustainable Development Goals.
It’s a fantastic piece of national research infrastructure and is a participatory model that could be replicated in areas where information and knowledge gaps have been identified, such as the Voluntary National Review of Australia’s progress on the 2030 Agenda for Sustainable Development and its goals.”