Extract, prepare,visualise and analyse soil and vegetation data from over 700 Australia-wide ecosystem monitoring plots with TERN’s R package.
Access the package and take advantage of existing R functionality, forget about local disk storage issues and substantially streamline your data analyses.
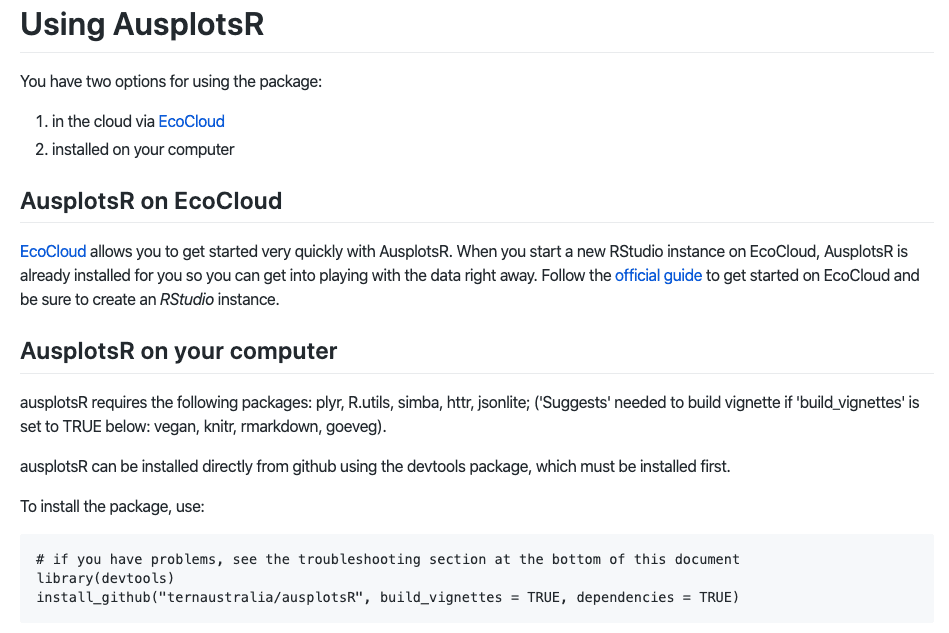
The TERN AusPlotsR package is openly available for download via GitHub. Version 1.0 of the AusPlotsR package enables live extraction, preparation, visualisation and analysis of all the TERN Ecosystem Surveillance data.
Through AusPlotsR, users can directly access plot-based data on vegetation and soils collected all across Australia from over 700 TERN Ecosystem Surveillance plots. The data includes physical sample barcode numbers to link with TERN’s Ecosystem Sample Library.
Hard at work exploring TERN’s brand new AusPlots R package, our Data Skills Workshop as part of #ESAus18 at @QUT pic.twitter.com/5gUvq5teBR
— TERN (@TERN_Aus) November 30, 2018
Streamline your TERN data analysis
Using the new R package, users can access the latest, up to date TERN data via direct database queries rather than pre-loaded, static datasets.
It also contains simple, self-contained functions that take care of many of the pre-processing steps needed to compile observations from hundreds of field plots. This means that, in a matter of minutes, a user can create multi-faceted data tables ready for ecological analyses, such as classification, ordination, species accumulation, diversity indices, vegetation structure, growth forms, tree basal area and fractional ground cover.
All outputs from the package are retained in the detailed raw data, including information on facets such as substrate cover and plant height across each plot at 1010-point intercepts.
By accessing TERN ecosystem data through AusPlotsR, users can take advantage of existing functionality in R, such as other ecological analysis packages, without needing to store databases or text files on their local disk. Doing so substantially simplifies analysis procedures, analysis updates and record keeping.
- The AusPlotsR package can be downloaded via GitHub and user instructions are also available.
- Detailed tutorials on how to use the package are also available via TERN’s GitHub page.
- Additional functionality will be added to AusPlotsR over time, such as draft functions to visualise aspects of the vegetation data and calculate more indices. The intention of these planned features is to quickly showcase the dataset to potential users and provide a resource for a wider user base, particularly tertiary education.
Day 2 of @ecoEd_ Champions training is underway! Bernardo Blanco-Martin from @TERN_Aus introducing #Ausplots and using the AusplotsR package to analyse #Australian #ecology #data pic.twitter.com/TJbC8ohN70
— ecoEd (@ecoEd_) December 11, 2018


