TERN data are being used to develop new tools to model and predict the occurrence of dust storms so that we can manage associated risks better in future.
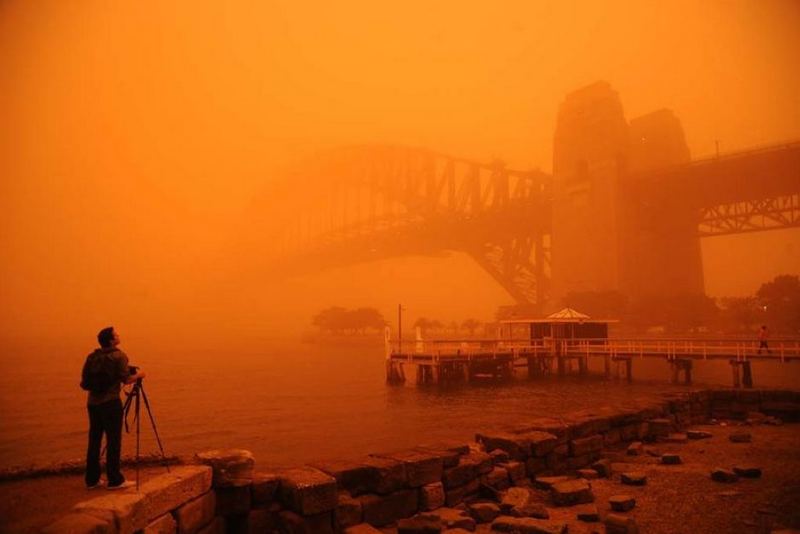
In late November 2018, a line of dust more than 500km long swept across the Victorian border, through Canberra and up to Queensland. Dust storms are more than just annoying—they can be bad for our health, ecosystems, and the built environment. The 2009 dust storm, which famously blanketed the city in a bright orange hue, cost the NSW economy more than $300 million.
TERN and its partners are working to mitigate the impacts of such dust storms.
The current drought has stripped a lot of ground cover across eastern Australia, leaving large areas of dry, exposed and vulnerable soil. One way to understand the risks of dust storms is to match weather forecasts with potential dust sources across the country and see if they are likely to meet up.
Dust storms in Sydney 22 November 2018 (left) and 23 September 2009 (left) (Images courtesy of Tago Fabic and Amber Hooper)
Satellite eye on vegetation change
Dr Juan Pablo Guerschman, a CSIRO research scientist and TERN user and collaborator, has been working with colleagues in the Australian, state and territory governments to deliver Australia’s ground cover monitoring products. This work is supported by the Australian Government’s National Landcare Programme.
“Using satellite data we can estimate landscape properties across the Australian continent, such as the proportion of the land that is covered by vegetation – either green or dry – or that is bare soil,” says Juan Pablo.
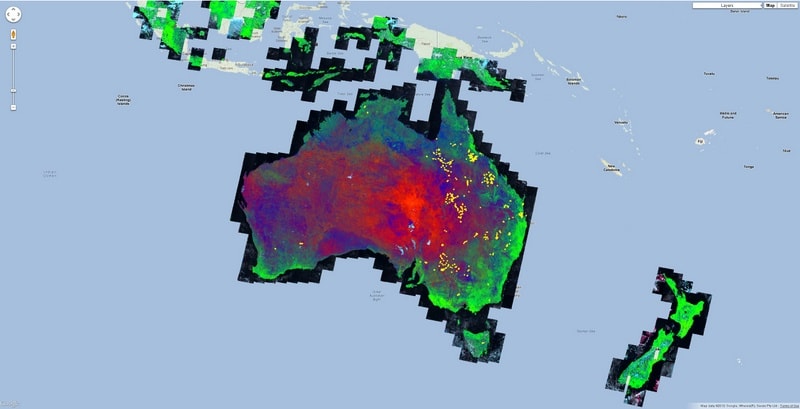
Ground cover data showing the proportion of the land that is covered by vegetation (green and blue) or that is bare soil (red) are openly available via TERN data portals
“When there’s windy weather and low ground cover, it means that there’s a risk of dust storms and erosion of our soil, and so particularly in spring and summer we know that our data products will be in demand.”
Every eight days a new image comes through from the US MODIS satellite. Juan and team have developed a system that takes that satellite imagery, runs it through mathematical calculations, developed by CSIRO and Joint Remote Sensing Research Program, validates it with field site information collected by project partners, including TERN, and delivers information about ground cover through TERN data services and the Rangeland and Pasture Productivity Map.
This is then picked up by data users such as the Community DustWatch program to assess where there might be sources of dust if the wind is strong enough.
The DustWatch program tracks wind erosion across Australia and produces a range of maps and products for use by governments and land managers and to warn agencies monitoring air quality of incoming dust storms.
Beyond dust-watching
In addition to dust forecasting this type of research is also useful in Australia by providing research publications to help assess soil condition and land-management targets, manage grazing, and track our carbon budgets. Researchers can also link this land cover information with biomass and animal production models to understand how we can sustainably produce more food.
But the work doesn’t stop there. TERN continues to explore new opportunities for using remote sensing technologies to monitor ground cover. For example, in one project several small, compact and wirelessly networked sensors have been installed across the landscape to measure light levels, temperature, humidity and soil moisture to monitor the drying of a landscape at a greater level of detail than ever before.
Not the ideal white Christmas
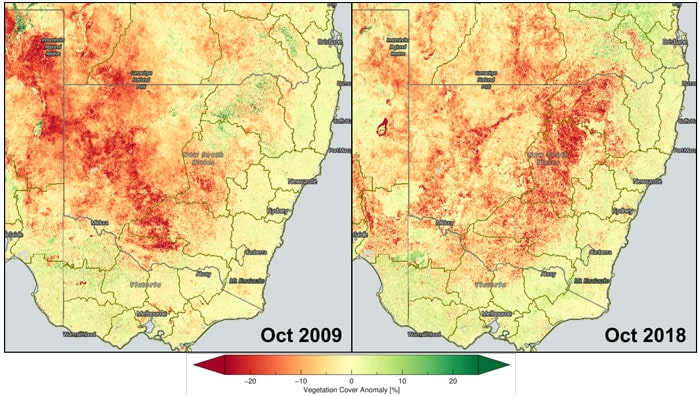
In many parts of Western NSW, vegetation levels are the lowest they’d been since Juan and his team started capturing images of the cover in 2001. Some additional analysis by the DustWatch project suggests that the vegetation cover this summer may plummet to the low levels observed in previous droughts.
The current conditions aren’t as severe as those from the dust storm of 2009 – but can still cause strife (images courtesy of CSIRO)
So, whilst we might be in for a long, dusty summer, it’s reassuring to know that we have the expertise, data and tools to predict future dust storms and give some advance warning to communities in their path.
Ground cover data showing the proportion of land that is covered by vegetation or that is bare soil are openly available via the TERN Data Discovery Portal.
It’s likely that the data from this research will form part of the National Environmental Prediction System (NEPS), which will underpin strategic decisions for the management of our entire continent and surrounding oceans.
This story has also been published in CSIRO Scope - “The dust days aren’t over”
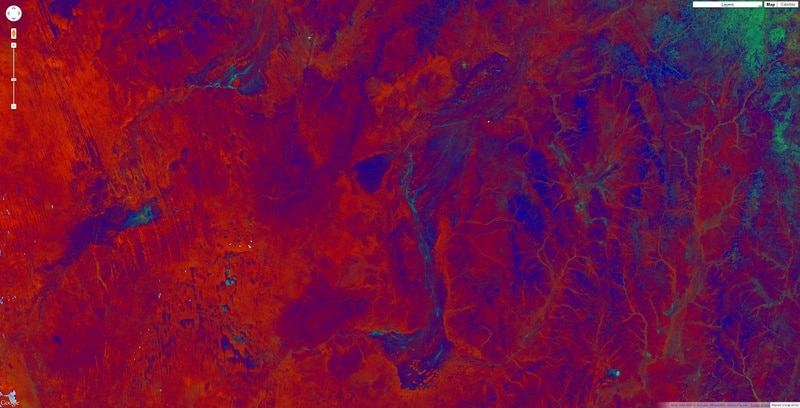
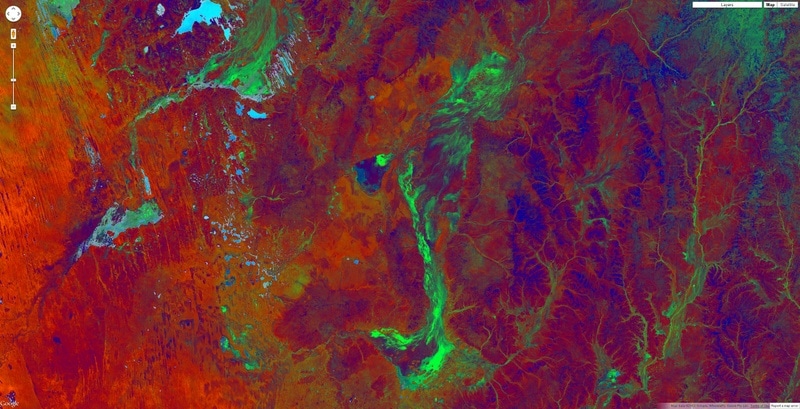
Satellite-derived ground cover estimates for the Diamantina River region, showing bare ground (red), green vegetation (green) and non-green vegetation (blue). The image above shows the region in 2006, a particularly dry year when the landscape was very bare, with little green or dry vegetation cover. In contrast, the image below shows the same landscape in 2007 following flood events resulting from cyclone runoff, when the river channel has come to life.