Describing patterns of flowering time in plant communities across six biomes, and showing how they relate to climate means and climate predictability – all using open-access data and a reproducible analysis in R.
Article by Ruby E. Stephens
Ruby E. Stephens is a PhD candidate at Macquarie University, Sydney, Australia and a plant ecologist with broad interest in the macroecology of plants and pollination. Ruby’s recent paper “Climate shapes community flowering periods across biomes” was chosen as the Editors’ Choice article in the Journal of Biogeography.
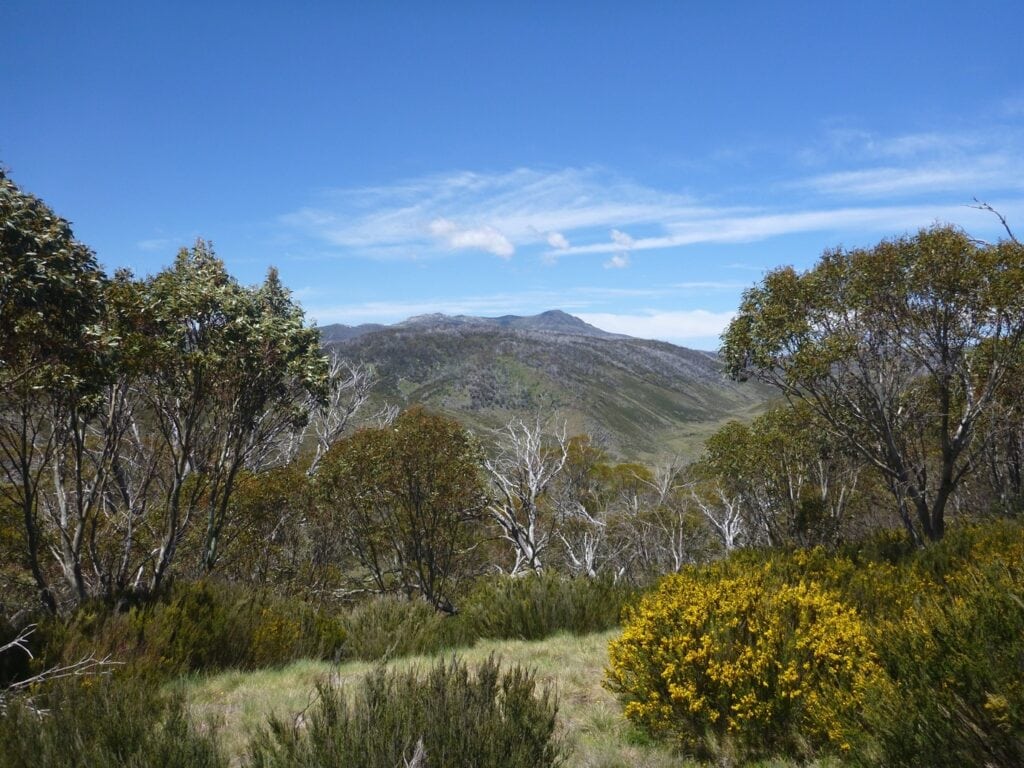
Bossiaea foliosa (Leafy Bossiaea) flowering in the Snowy Mountains in southeast Australia. Alpine flowering is often highly concentrated, as everything must flower, pollinate and set seed in the few months of summer when it isn’t under snow.
When you travel Australia from the desert to alpine areas, from the tropics down to temperate forests, different patterns of flowering in the plant communities you encounter may be obvious. Some plant communities seem to flower at the same time every year, exploding into flower in spring or early summer. In other plant communities flowering is much more dependent on conditions, as plants wait for rainfall or even the flush of nutrients after a fire to start their flowering.
In this study we wanted to use data to describe these patterns of community flowering across the Australian landscape. We asked how community flowering patterns related to climate, and especially climate predictability – a measure of how stable or predictable climate is from month to month and year to year, which is a much more comprehensive measure of environmental variability in aseasonal landscapes.
Luckily for us there were two existing sources of high-quality data to look at these questions – TERN’s AusPlots, which has plant abundance data from more than 800 consistently measured vegetation plots across Australia, and the AusTraits database, which collates over 1 million records of plant traits for Australian taxa.
With a fair bit of wrangling – this was my first project using R for data analysis – we combined AusPlots plant community abundance data with AusTraits data on species’ flowering periods. From this we calculated the mean length of flowering period (in months, so 1-12) for 629 plant communities across six biomes in Australia, weighted by species abundance in plots.
This was a lot of data and analysis to keep track of! Despite the steep learning curve and many points of frustration learning to use R and version control with git, I can’t recommend the programmatic approach to data analysis highly enough. Being able to add to, and re-run, sections of the analysis, with comments to keep track of each step along the way, made it possible to break a big data task down into manageable chunks, and come back after a break and remember what you’d done. Using R with git also helped our analysis and data to be as open access and reproducible as possible – you can check out our analysis (and even download and re-run it if you like!).
Once we’d calculated community weighted mean flowering periods, we found some clear differences between community flowering periods in different biomes, a fair portion of which was explained by climate. The patterns reflected observed patterns in these biomes: alpine flowering is highly concentrated, as everything must flower, pollinate and set seed in the few months of summer when it isn’t under snow. At the other extreme, desert flowering tends to be very aseasonal, as desert species mostly flower in response to sporadic rainfall.
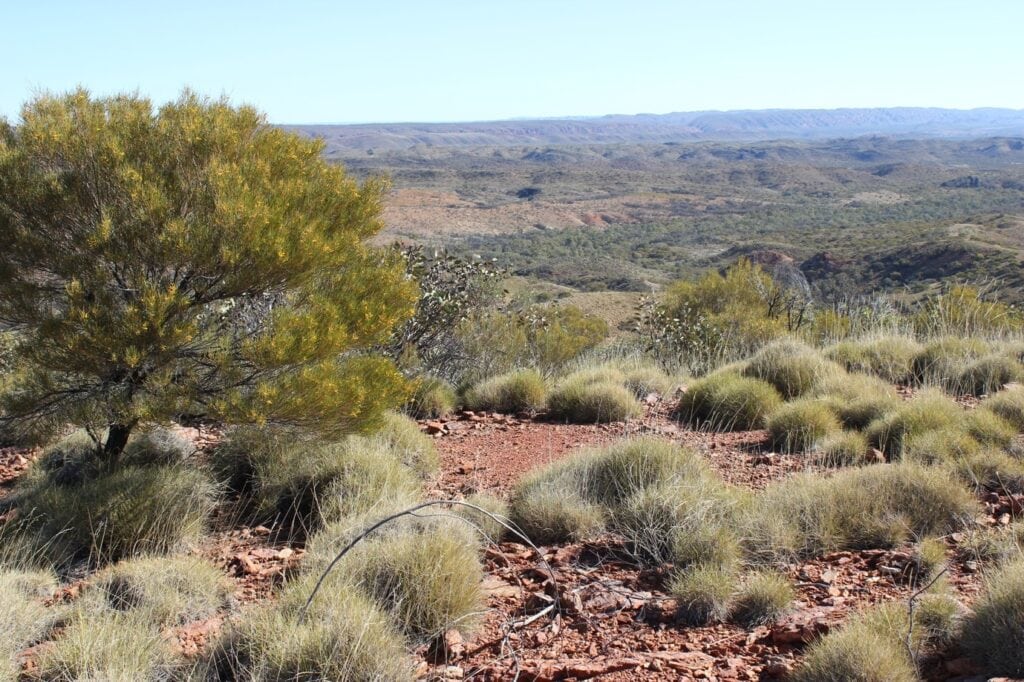
Acacia macdonnellensis (MacDonnell mulga) and Triodia spp. spinifex flowering in Tjoritja/West MacDonnell National Park in central Australia. Under current and future climate warming plant community flowering might shift towards longer, more responsive flowering periods, as are currently found in desert biomes. (Credit: Ruby E. Stephens)
When we were writing up this study an inevitable question was raised: if plant community flowering is tied to climate, how might it respond to climate change? We can only speculate, but species extinctions and range shifts as well as changes in the patterns of plant species’ flowering may lead to longer, more responsive flowering periods in a warming world. Future work might be able to document climate change induced flowering shifts at the landscape scale, though it will take a mountain and a half of data!