Quickly and easily download detailed maps depicting C3 and C4 plant cover and the stable carbon isotope values of vegetation, known as a δ13C isoscape, for all of Australia.
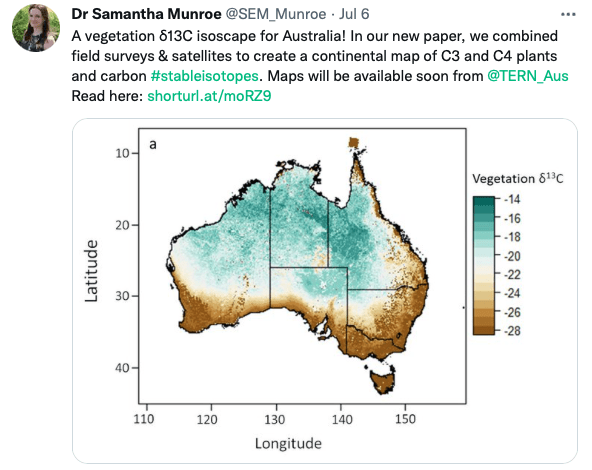
TERN is excited to launch a new set of open-access data products that will advance research in a range of subjects, including food chain dynamics, animal migration, carbon fluxes, and plant productivity. As described in Landscape Ecology, we created maps defining C3 and C4 plant cover, as well as a vegetation δ13C isoscape, for the entire Australian continent.
Plant distribution is shaped by photosynthesis and climate
The different ways plants convert CO2, sunlight, and water into food—called photosynthetic pathways—have a huge impact on species abundance and distribution. Plants with a ‘C3’ pathway, which include many grasses, most shrubs, and nearly all trees, have adapted to cool, more temperate habitats. In contrast, ‘C4’ plants, which include grasses, sedges, and some forbs and shrubs, have evolved to survive in hot and sometimes stressful conditions.
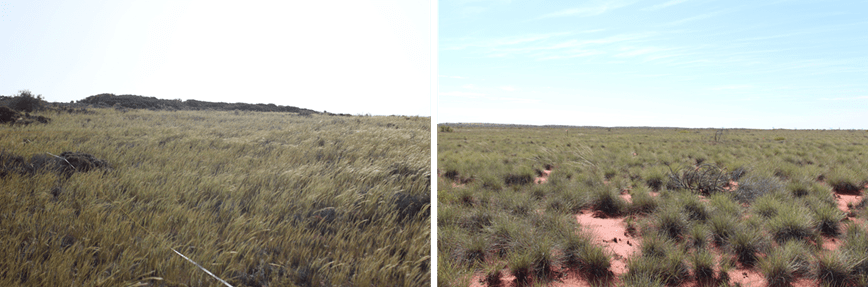
C3 grasses like Balcarra grass and ringed-wallaby grass grow in the cooler areas of South Australia (left), (b) while warm-season C4 grasses like humpback spinifex grow in hotter, dyer areas like those found northern Western Australia.
C3 and C4 plants also have a unique range of stable carbon isotope (δ13C) values. The carbon isotope value is the ratio of heavy to light carbon (13C/12C) in plant tissue. As a result of their distinct photosynthetic pathways, the δ13C values of C3 plants are much more negative (~-27‰ δ13C) than for C4 plants (-13‰ δ13C).
“Factors such as temperature, rainfall, and even soil texture and chemistry, control the distribution of C4 and C3 plants. We believed that if we could use climate variables to predict the relative distribution of C4 and C3 plants, we should also be able to calculate the average δ13C values of vegetation in a given area and create an isoscape.” Dr Sam Munroe, TERN and The University of Adelaide
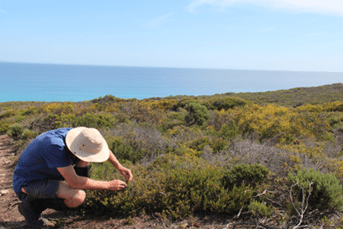
Dr Samantha Munroe, Postdoctoral Fellow at the University of Adelaide and Research and Development Scientist with TERN Australia. (Credit: S. Munroe)
An isoscape, shortened from Isotope Landscape, is a spatially continuous prediction of stable isotope values over geographical areas. Understanding the spatial distribution of δ13C in vegetation is vital to a diverse array of critical research questions. For example, δ13C isoscapes are commonly used to study food webs and animal migration.
“Animal tissues reflect the δ13C value of their diet. When it comes to isotopes, you are what you eat! When an animal’s δ13C value matches the δ13C value of local plants, this indicates that this individual likely eats local vegetation and lives in that area. But, if an animal’s δ13C value doesn’t match local plants, it is probably not from that area. Simply by comparing the carbon isotope ratios of an animal to its environment, we can learn a great deal about its behaviour and movement, like migration paths, breeding habitats, or favourite foods.” – Dr Sam Munroe, TERN and The University of Adelaide
Terrestrial δ13C maps are not just limited to studying animal behaviour however; they can also be used to study carbon exchange between the biosphere and atmosphere, as well as the water use efficiency of different species under changing environmental conditions.
An Isoscape for Australia
While δ13C isoscapes already exist for other continents like North and South America, until now none have been available for Australia.
“Given their high scientific value, the lack of a δ13C isoscape of Australia was a major data gap, and severely limiting national research potential. We set out to change that.” Dr Irene Martin, TERN and The University of Adelaide
To create a terrestrial vegetation δ13C isoscape for Australia, the authors combined a variety of remote sensing and field survey data. First, they developed a novel model that could predict C4 and C3 cover relative to climate and soil attributes.
“We calculated C4 and C3 cover at over 700 of TERN’s one-hectare ecosystem monitoring plots, and compared these values to local climate and soil conditions. Our analysis found that seasonal rainfall, maximum summer temperature, and soil pH were the best predictors of C4 cover. If temperatures increased, or if there was greater summer rainfall, C4 was more dominant. We also observed areas with higher soil pH tended to have less C3. This model enabled us to calculate C4 and C3 plant cover across Australia, even in areas where ground data were not available.” Dr Sam Munroe, TERN and The University of Adelaide
The authors also estimated the extent of Australian cropland and assigned each crop a photosynthetic type.
“Cropland had to be considered separately to natural habitats because the photosynthetic pathway of cropland is controlled by humans, not climate. C3 crops like cotton and wheat, for example, are grown all over the country.” Dr Greg Guerin, TERN and the University of Adelaide
Once the natural and agricultural predictions of C4 and C3 cover were complete, the authors combined their results to create full maps of C4 and C3 vegetation for the entire continent. A simple equation was then used to calculate the average δ13C value of vegetation at a 100 m x 100 m resolution, which produced the isoscape.
TERN Australia has conducted over 800 plant surveys in every major habitat in Australia. Teams of up to 6 people recorded the different species at each site.
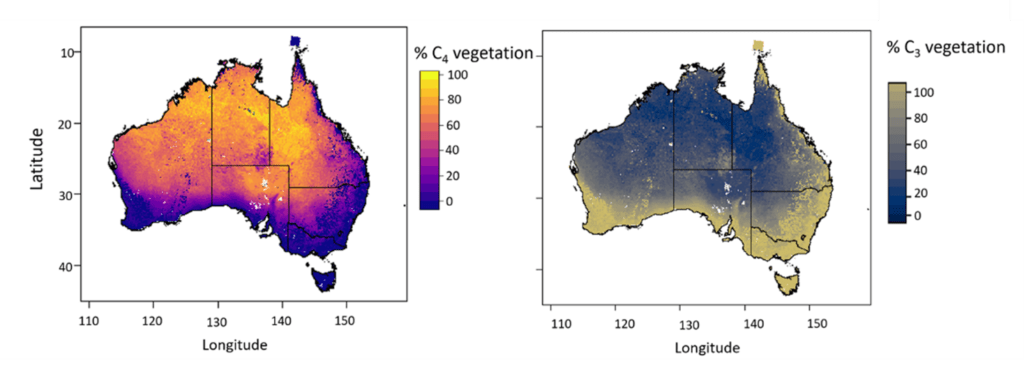
Proportional C4 and C3 vegetation cover (proportional to total vegetation) in Australia (Credit: S. Munroe)
Southern areas of the country, which are characterised by cooler temperatures and high winter rainfall, were dominated by large areas of C3 cropland and woody vegetation, and as a result had the most negative δ13C values. Mid-western and eastern coastal regions also had a large proportion of C3 vegetation, including a mix of forests, cropland, and herbaceous vegetation, and had correspondingly low δ13C values. C4-dominated and 13C-enriched areas included northern savannahs and grasslands.
TERN maps, models and ecological samples are freely available for use
These new maps and models are designed to work easily in most data analysis platforms, such as R and ArcGIS. They are readily available from the TERN Data Discovery Portal.
However, this δ13C isoscape is likely only the beginning. TERN scientists intend to create additional isoscapes for soil and vegetation that will multiply the analytical power of these new maps.
“Our next goal is to create sister isoscapes representing δ13C and δ15N in the soil, work that is made possible by the over 60,000 soil samples TERN has collected from across the country. Soil and vegetation samples from the TERN Collection are available for any researchers to use!”