Researchers have taken advantage of TERN’s trusted national and long-term data to develop the latest in an annual series of environmental condition reports. The report, and its accompanying interactive website, provide an annual summary of 15 key environmental indicators and how they have changed over time.
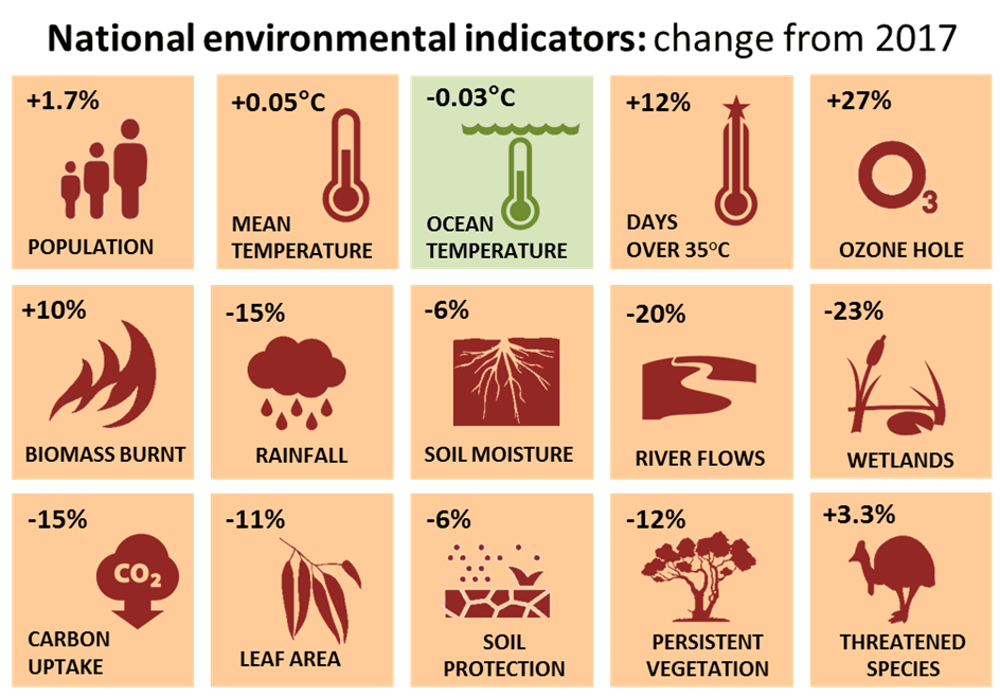
“Temperatures went up again, rainfall declined further, and the destruction of vegetation and ecosystems by drought, fire and land clearing continued. Soil moisture, rivers and wetlands all declined, and vegetation growth was poor.”
That is the main conclusion from Australia’s Environment in 2018, the latest in an annual series of environmental condition reports, released in April 2019.
Indicators of Australia’s environment in 2018 compared with the previous year. Similar to national economic indicators, they provide a summary but also hide regional variations, complex interactions and long-term context.
The report uses open data from CSIRO, the Bureau of Meteorology (BoM), the Australian Bureau of Statistics (ABS), Geoscience Australia (GA), TERN and our cognate NCRIS projects IMOS and ALA to provide an annual summary of 15 key environmental indicators and how they have changed over time.
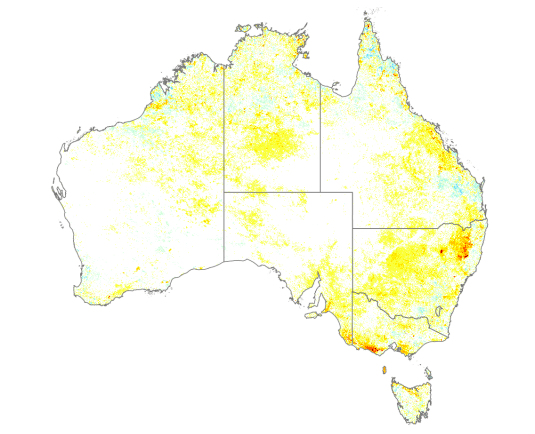
TERN delivered remote sensing data from Australia's Environment showing a decline in the area of persistent vegetation cover across Australia in 2018, ranging from -3% (yellow) to -35% of the area (dark brown)
ANU WALD’s Shoshana Rapley, who contributes to the project, says “The combined pressures from habitat destruction, climate change, and invasive pests and diseases are taking their toll on our unique plants and animals. Another 54 species were added to the official list of threatened species, which now stands at 1,775. That is 47% more than 18 years ago and puts Australia among the world’s worst performers in biodiversity protection.”
“On the upside, the number of predator-proof islands or fenced-off reserves in Australia reached 188 in 2018, covering close to 2,500 square kilometres. They offer good prospects of saving at least 13 mammal species from extinction.”
Professor Albert van Dijk, who leads the annual report, says “Of particular importance to our analysis are the long time-series data, such as the satellite-based ecosystem data that is available through TERN.”
“These long-term datasets allow us to assess patterns of change in Australia’s ecosystems, which is critical to understanding and managing our environment.”
“We can only deliver our annual report because we can access trusted, national data from a range of sources, and then use the National Computing Infrastructure’s world class infrastructure to integrate and analyse the data,” says Albert.
For more information about the ‘Australia’s Environment’ reports, please visit the website, or contact Professor Albert van Dijk directly.
For more information on TERN’s long-term landscape-scale remote sensing data click here.
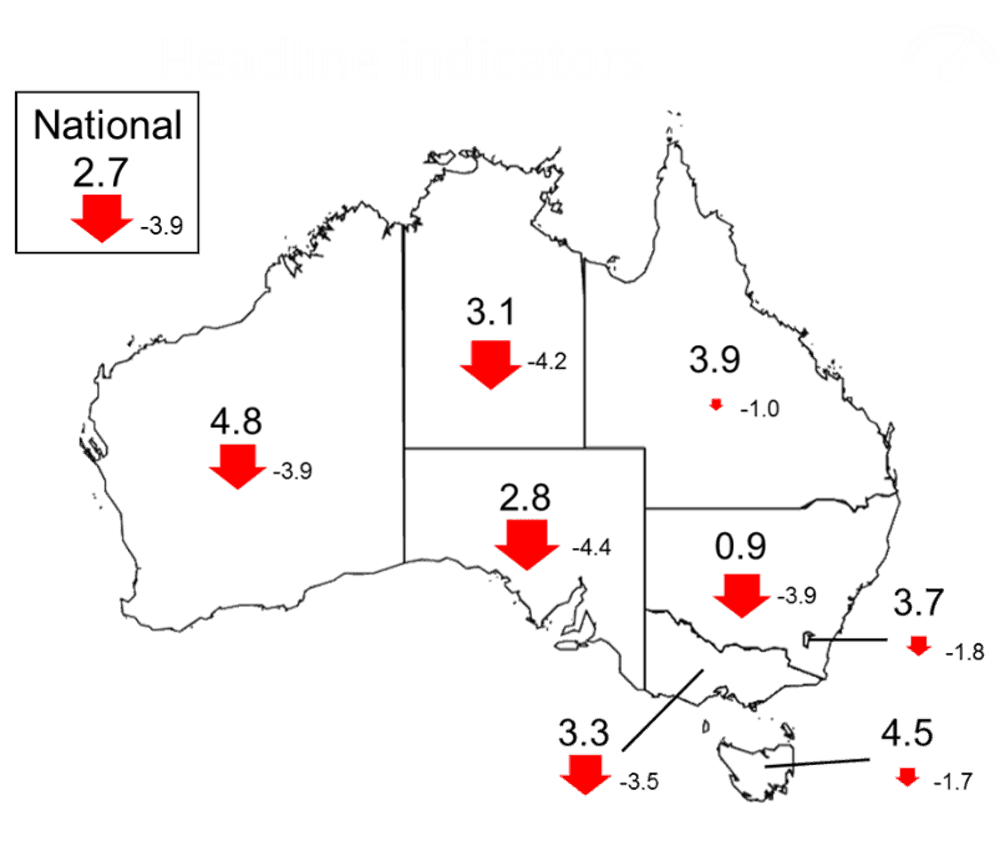
Environmental Condition Score in 2018 by state and territory, based on a combination of seven indicators. The large number is the score for 2017, the smaller number the change from the previous year.
We at TERN acknowledge the Traditional Owners and Custodians throughout Australia, New Zealand and all nations. We honour their profound connections to land, water, biodiversity and culture and pay our respects to their Elders past, present and emerging.