
 Craig Leaf Area Index measurements Credo Salmon gum plot 16Sep20 1000")

Phenology camera data
New phenology camera data has been released by TERN; these include chromatic indices data from newly deployed phenocams.
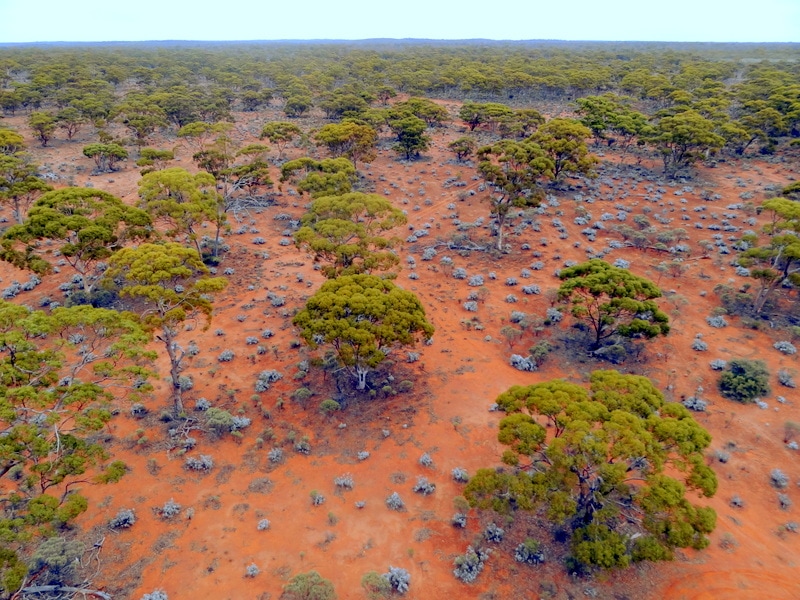
Phenology is the study of cyclic vegetation changes over time, such as the seasonal colour changes of northern hemisphere deciduous forests. In Australia, TERN’s time-lapse cameras are monitoring the timing of changes in vegetation greenness and providing vital information on our changing ecosystems and their services.
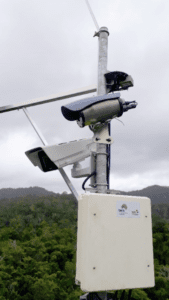
TERN maintains numerous instrument towers around Australia from which sensors measure various ecological parameters. Among the instruments on these towers are phenology cameras, also called phenocams, which point downwards and automatically deliver a stream of photographic data (10 to 24 images per day) during daylight hours, of canopy and understory vegetation changes in their field of view.
Using telecommunication, the remote cameras are connected to TERN data servers, and upload time-series data (images) automatically. They also flow to a central platform developed collaboratively by TERN for storage and processing into a number of in-demand products for the research community, including a ‘greenness’ index and other chromatic indices using vegindex, the post-processing framework for PhenoCam Web Services.
The new data set TERN is publishing includes nearly 600,000 legacy and real-time phenocam images, recorded via 63 TERN phenocams across 18 SuperSites that TERN samples regularly. The location of TERN SuperSites covers all Australian biomes, including mountain eucalypt forests in Victoria, Northern Territory savannahs, Wandoo woodland in Western Australia, rainforest in the Queensland wet tropics, plus all other habitat types.
The data set spans 2012 to present and collection is ongoing. The degree of continuity varies depending on the type of camera and location. Most cameras will have capacity for at least one year’s worth of images.
Analysis of the images is complicated.
“Scientists define a region of interest on a base image,” says Dr Habacuc Flores-Moreno, TERN Data Curation Analyst. “Chromatic coordinates, or quantitative colour estimates, are calculated for this region in all images across time. In effect, you are looking at the same spot in an image and can record how its colour changes cyclically from season to season over years.”
TERN hosts the data and enables researchers to freely access it.
“It is difficult to imagine that the effort of collecting and analysing the data could be done without a national-level infrastructure that is also enriched with ecosystem process monitoring,” concludes Dr Flores-Moreno.
The data set is now available here and includes images for both legacy and existing operated phenocams. Chromatic coordinates (and a very comprehensive range of calculated colour parameters important for analysis) are available only for real-time cameras. Other parameters, such as time and date, information on lighting conditions, solar elevation, latitude and longitude, and breakdown of vegetation types, are published with the chromatic indices.
More phenocams will be deployed on TERN sites and images will be processed near-real-time to derive chromatic indices daily. In the future, chromatic indices will be published as a separate data stream to improve ease of access to derived data.