An international team of scientists hoping to uncover global patterns in the relationship between a plant’s form and the environment and climate in which it lives, were only able to explain less <10% of the variation found in key functional patterns of leaves, the primary organ for light and carbon capture. In the first of several popular science articles from TERN, Prof. Andy Lowe explores alternative ways of solving this global scientific dilemma.
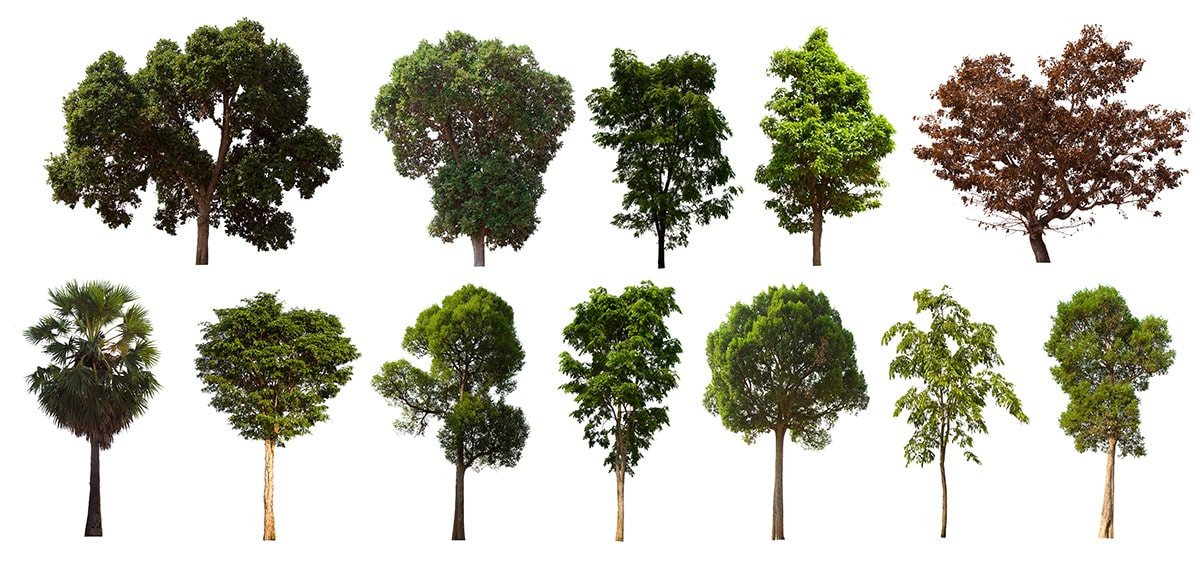
We’ve all noticed that vegetation and the size and shape of plants and their leaves changes as we move across different climates. In the tropics, trees are tall with big leaves, in alpine areas vegetation tends to be low and shrubby with small leaves, and in the arid interior of Australia mallee vegetation comprises small multi-stemmed trees with long thin leaves. Interestingly most species in these different climates display these characterises largely independent of their evolutionary origin.
This relationship between a plant’s form and the environment and climate in which it lives is known as functional ecology. And scientists have spent decades analysing and modelling the basic rules that govern the form and function of vegetation. For example, we know that higher average temperatures produce vegetation with long leaves, lower rainfall is associated with narrower leaves, and higher rainfall with taller trees. All of these characteristics are driven by basic physical and ecophysiological limitations relating to growth period, tactics to preserve water and the capacity of plants to transport water up their stems or trunks, leading to well-described spectra of plant form and function.
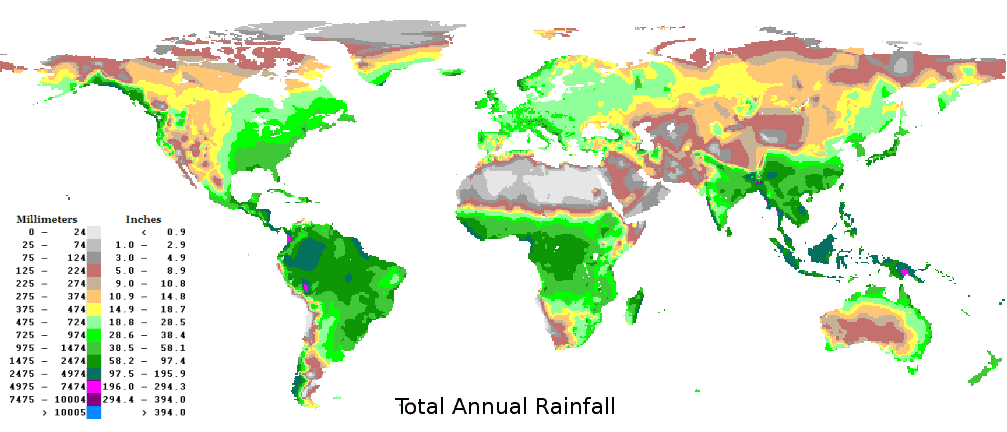
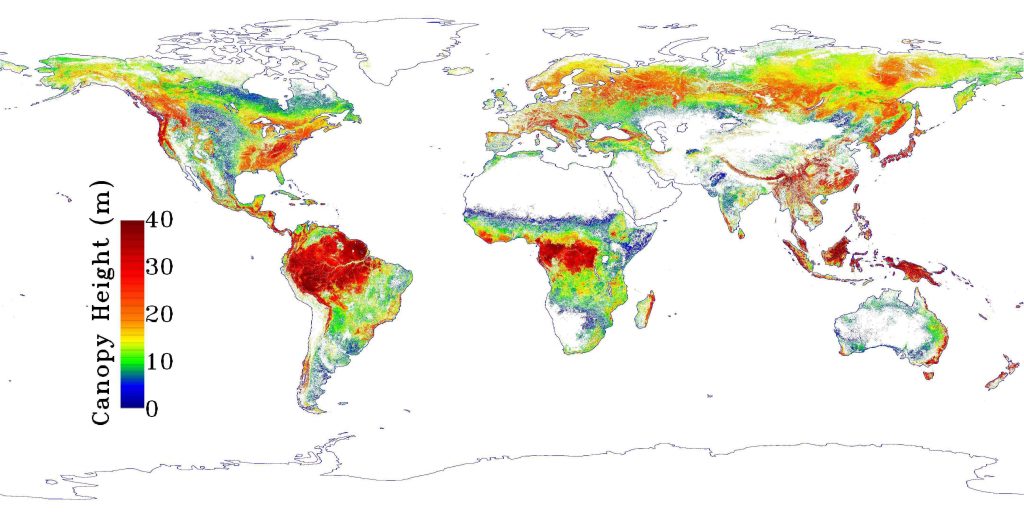
A comparison of global rainfall (above) and tree height distribution patterns (below). At a global scale plant height increases with rainfall. (Credits: http://www.climate-charts.com/images/world-rainfall-map.png and NASA/JPL-Caltech)
It was rather surprising, then, when an international team of scientists hoping to uncover global functional trait patterns at a community level were only able to explain less than ten percent of the variation found in key functional patterns of leaves, the primary organ for light and carbon capture. This was the result of a massive cooperative effort to combine aggregated plot data (sPlot) and plant traits (TRY) to test these global patterns for the first time. The analysis used an unprecedented 1.1 million vegetation plots and assigned trait values for 20 million individual species observations, including data representing Australia provided by TERN.
Some of the possible reasons for the lack of identifiable relationships include the inherent variation between species in different biomes, evolutionary history, the role of microclimatic variation and disturbance, and the inherent loss of resolution when combining data collected using different survey methodologies.
So how else might this problem be approached?
Well, a continental approach that limits the evolutionary history and biome variation and uses a standard survey method is likely to prove more powerful in uncovering ecological fundamental relationships.
Recent work using data from the Ecosystem Surveillance platform of TERN did just this, combining data collected from over 400 AusPlots sampled across the Australian continent with the new AusTraits dataset of plant functional traits.
Using this approach more than 40% of the variation in the plant functional character data set was explainable by climate and environment.
The key relationships identified were:
- Average leaf size and plant height were higher in warmer, seasonally wet environments where there is higher evapotranspiration.
- Average leaf area was related to seasonal precipitation levels and winter minimum temperatures, so that drier habitats with cold winters had vegetation with smaller leaves.
- A third key functional trait, seed mass was not found to vary with environment, meaning that further work is required to determine why trade-offs between seedling growth rate and competition for light do not result in more obvious patterns.
These relationships help us model the expected distribution of vegetation types both under current environment conditions and pressures, and into the future with advancing climate change. These predictions allow us to understand the conditions which will likely lead to major ecological turnover and change, some of which are important for our forestry and pastoral farming industries. For example, this type of analysis can inform changes in vegetation type and plant primary productivity.
The analysis of TERN AusPlots together with AusTraits demonstrates the immense value of these nationally standardised datasets for solving longstanding questions in biogeography and functional ecology. Efforts to derive these regional relationships can also be built into a more nuanced global approach.
While merging plot and trait data at national level has proved fruitful, TERN is now looking to add value to its collection of over 90,000 plant samples from across the continent by gleaning key functional information through lab measurements and assays that will add to TERN’s functional knowledge base.
- Article by Andrew Lowe
- With thanks to Greg Guerin for providing an interview on which the piece is based and comments on the text.
References
Bruelheide, H., Dengler, J., Purschke, O., Lenoir, J., Jiménez-Alfaro, B., Hennekens, S. M., … & Jandt, U. (2018). Global trait–environment relationships of plant communities. Nature ecology & evolution, 2(12), 1906-1917.
Falster, D., Gallagher, R., Wenk, E., Wright, I., Indiarto, D., Baxter, C., … & Schulze, E. D. (2020). AusTraits–a curated plant trait database for the Australian flora. bioRxiv – in review Scientific Data
Guerin, G.R., Gallagher, R.V., Wright, I.J., Andrew, S.C., Falster, D.S., Wenk, E., Munroe, S.E.M., Sparrow, B. & Lowe, A.J. (submitted) Environmental correlates of key functional traits in Australian plant communities based on relative abundance in plots. Basic and Applied Ecology [submitted 5/5/2021]
Kattge, J, Bönisch, G, Díaz, S, et al. (2020) TRY plant trait database – enhanced coverage and open access. Global Change Biology 26, 119–188.