Hundreds of soil samples collected by TERN across Queensland have been filling knowledge gaps about phosphorus, particularly in remote locations, and allowed production of a more accurate and useful map on phosphorus availability in Queensland soils. The map will assist pastoralists, government and researchers improve the productivity and profitability of the state’s agricultural industries.
Phosphorus (P) is an essential element for livestock nutrition. Taken up from the soil by pastures and ingested by cattle, it plays an important role in the conversion of grass or feed into energy, the growth and repair of body tissue and, in pregnant cows, the supply of phosphorus to the foetus and the production of milk.
However, deficiencies in phosphorus across northern Australia limit the productivity and profitability of the grazing industry in this region and graziers often rely on expensive soil fertilisers and supplements to boost phosphorus levels.
Understanding the status of soil phosphorus across large areas provides the information graziers need to improve the efficiency of supplementation and fertiliser application and realise significant economic and environmental benefits for the industry.
The Queensland Government’s Department of Environment and Science (DES) has used hundreds of soil samples collected by TERN from across Queensland to map phosphorus for the northern Australian grazing industry.
The new ‘Available-P’ map will facilitate improved pasture and animal nutrition research and much more, says Peter Zund, DES Senior Soil Scientist, who leads the project with Steven Bray from Qld Department of Agriculture and Fisheries (DAF).
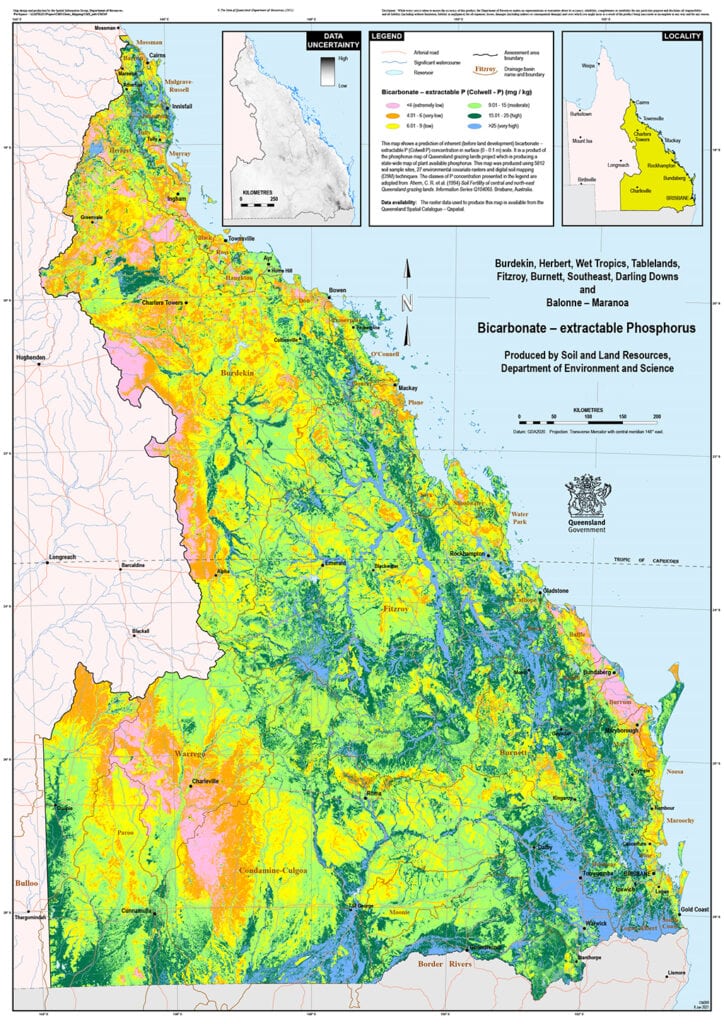
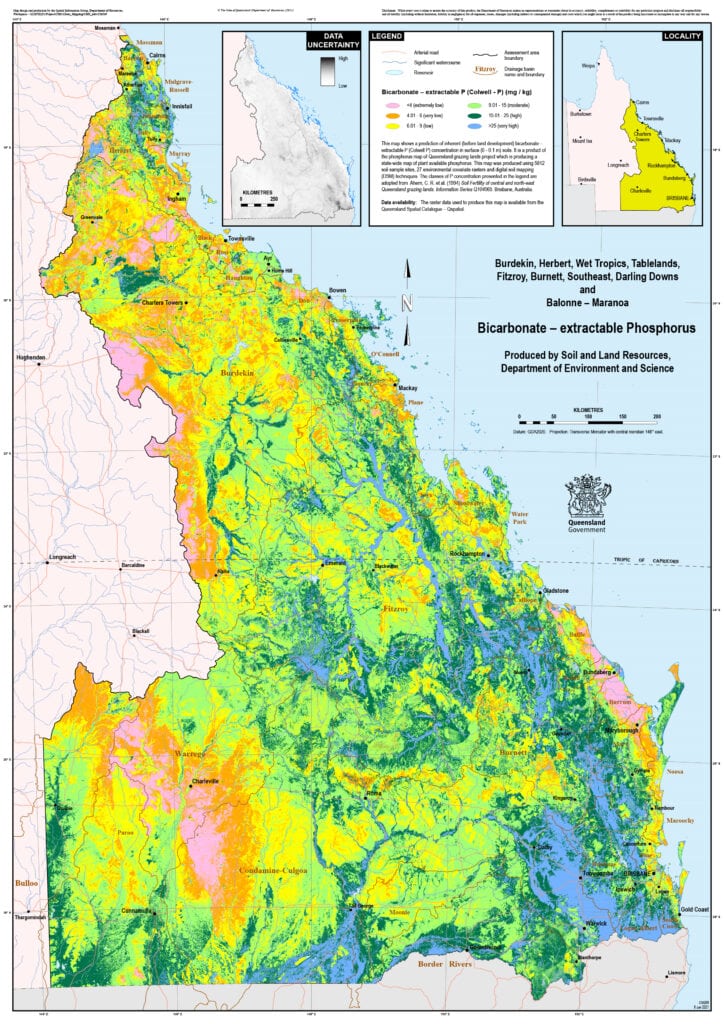
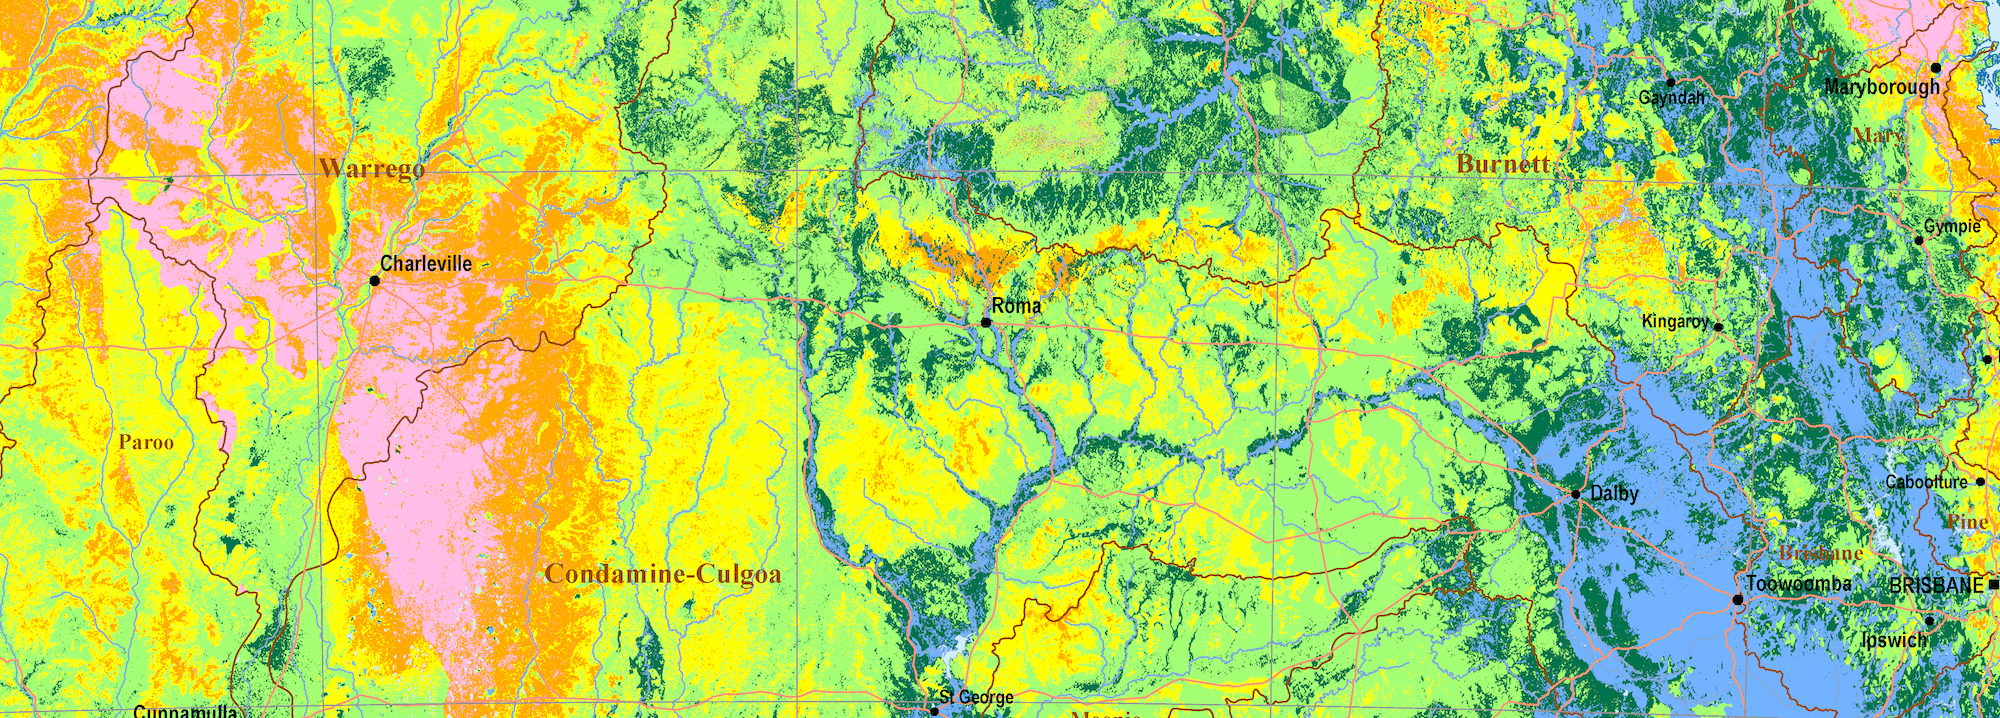
The new ‘Available P’ map shows a prediction of inherent (before land development) bicarbonate – extractable P (Colwell P) concentration in surface (0 – 0.1 m) soils (credit: Queensland Government)
“Knowledge of property-wide phosphorus concentrations in soils will allow researchers to better design grazing trials and inform the placement of infrastructure to improve evenness of grazing.
The map also is helpful to those modelling water quality in catchments or modelling pasture growth.
While a total P map has been available for the whole of Australia for years, it did not adequately represent the problem of phosphorus constraint faced by the grazing industry because only a small proportion of phosphorus in soil is available to plants.
With support from Meat and Livestock Australia (MLA) and soil samples from TERN and landholders across Queensland, we were able to add vital data to the existing Queensland Government soil databases.
The TERN samples filled data gaps in remote locations, which in many cases would have been difficult and costly for the Queensland Government scientists to obtain.
Peter Zund, Department of Environment and Science, Queensland Government
270 soil samples, collected from 110 TERN long term monitoring sites across Queensland, were used by the Queensland Government in the map’s production. For each of these sites, a 20 gram surface (0-10 cm) sub-sample was analysed. In addition, 23 of the 110 sites were used for detailed phosphorus analysis down the soil profile to a depth of one metre.

TERN samples filled spatial data gaps in remote locations across Queensland, which in many cases would have been difficult and costly for the Queensland Government scientists to obtain. Queensland Government soil collection sites are shown in beige and TERN-collected soil samples in white (Credit: Peter Zund).
A more useful phosphorus map for the whole of Queensland
The ‘Available-P’ map incorporates phosphorus data and a series of environmental covariates developed from terrain, geophysical, climate and satellite data. This map represents the inherent soil phosphorus levels before amendment by fertiliser or removal by cropping or pasture grazing.
“Phosphorus is a key nutrient for pasture legumes, which also improves nitrogen availability and pasture quality. However, plant roots can only take up soluble phosphorus, which typically accounts for only 5% of the total P. Current maps of total phosphorus are easier to produce but are not reflective of the pasture or animal phosphorus status.
Instead of mapping total phosphorus, the project mapped Colwell P which correlates with sorbed P and has been empirically related to critical plant concentration. To map inherent surface soil Colwell P, the project chose legacy phosphorus data contained in soil databases that were from non-cropped or unfertilised fields.”
Steven Bray, Senior Grazing Landscapes Scientist, Department of Agriculture and Fisheries, Queensland Government
The next stage of this Queensland Government project will include Western Queensland and is expected to be published later in 2021. The spatial data used to make this map is available via the Queensland Spatial Catalogue on Open Data Queensland.
- Soil pit, sub-surface and metagenomics samples, collected from >800 TERN monitoring sites across Australia, are freely available. Please contact us if you are interested in more information about the 24,000 soil samples in TERN’s collection.
- TERN’s Luke Finn and The University of Adelaide’s Associate Professor Luke Mosley will be presenting at the Soil Science Australia Conference on this work on Tuesday 29 June in Cairns. Peter Zund will also present a poster at the conference.
Going to the @SoilScienceAust conference?
— TERN (@TERN_Aus) June 24, 2021
Be sure to catch @DrLukeMosley on 29/6 talking about TERN's investment in critical long-term monitoring #ResearchInfrastructure & exciting new #soil phosphorus maps for Nth Aust!🗺🤩https://t.co/UxhycQIwlU#NCRISimpact @QldGov #agchatoz