Quickly and easily download the photosynthetic pathway of every plant species recorded across TERN’s entire national plot network.
TERN is excited to announce the launch of a new open-access data product created to support research on plant diversity.
As described in the latest edition of Scientific Data, we have just released a new dataset that lists the photosynthetic pathway of every vascular plant species recorded across 541 TERN monitoring plots between 2011 and 2017. This includes >2400 species, many of which are only found in Australia.
Photosynthesis affects plant survival
The variations in how plants convert carbon dioxide (CO2) to carbohydrates (C6H12O6)—called photosynthetic pathways—have an enormous impact on species productivity, abundance, and distribution.
For example, plants with a ‘C3’ pathway have evolved to survive in cool, more temperate habitats, while ‘C4’ and ‘CAM’ (crassulacean acid metabolism) plants are better adapted to hot and potentially highly stressful conditions.
This means they will exhibit starkly different responses to daily, seasonal, and long-term changes in factors like temperature, rainfall, soil salinity, or fire regimes.
The presence and abundance of C4 and C3 plants also strongly influences carbon and energy fluctuations, CO2 storage potential, and the structure and diversity of bacterial, fungal and animal communities. Given their ecological importance, the evolution of these different pathways and how they respond to change, in different ecosystems is a focal point of modern terrestrial research.
“Global warming is expected to have a huge impact on the competitive advantage of plants with different photosynthetic pathways. We anticipate big ‘bottom-up’ changes in terrestrial communities as plant species with different pathways shift across the landscape and reflect the new temperature and rainfall patterns in Australia. This means knowing the photosynthetic pathway of a species is an essential piece of information in ecosystem science.”
Dr Sam Munroe, TERN and The University of Adelaide

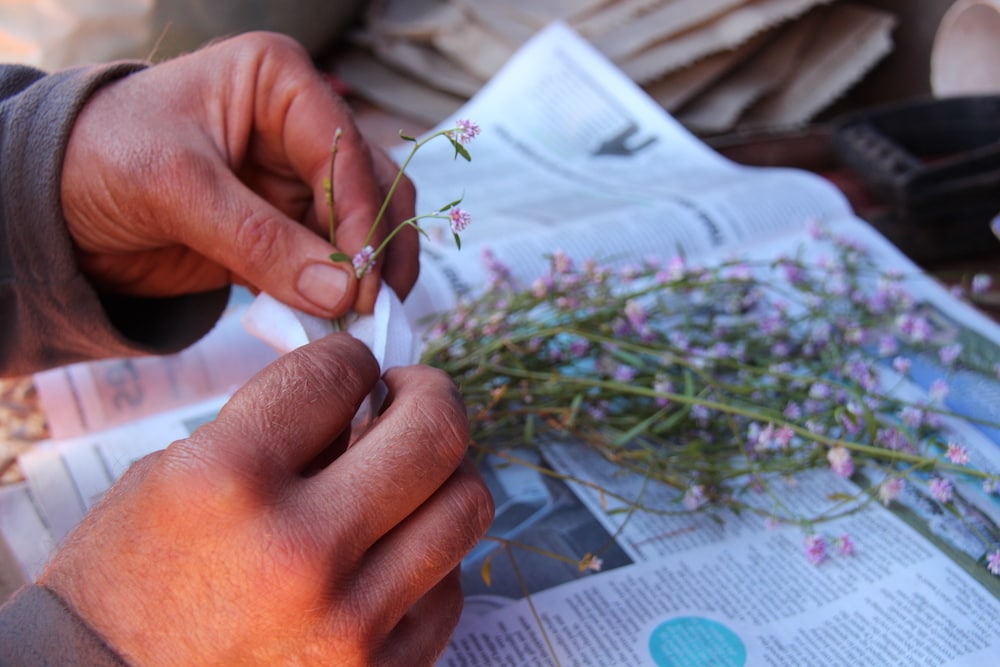
Dr Sam Munroe preparing TERN plant tissue samples for stable isotope analysis at the University of Adelaide
A new list for Australia
This photosynthesis pathway dataset was created by first listing every unique species recorded during field surveys conducted by TERN’s Ecosystem Surveillance platform. This list was then compared to over 30 peer-reviewed resources investigating the photosynthetic pathway of plants, to assign each species to their correct pathway. However, trying to determine the pathway of every species found at TERN plots turned out to be more complex than originally anticipated.
“There are quite a few international databases and publications that list the photosynthetic pathway of plant species, but we soon learned that many Australian species often get left out.
This could be because many of our more rare, remote, and endemic species don’t get the same level of scientific attention as species found in other countries. This meant we needed to discover their pathways for ourselves.”
Dr Sam Munroe, TERN and The University of Adelaide
To determine the pathway of > 400 species not previously assessed, Sam and her colleagues used vegetation samples collected at TERN surveillance plots to perform a technique known as stable isotope analysis.
This analysis measures the ratio of heavy to light carbon (13C/12C) in plant tissue, which demarks plants as using either C3 or C4 photosynthesis. With this technique, they were able to assign previously unknown species a photosynthetic pathway.

Percentage C4 cover (relative to total C3 and C4 cover) at TERN Ecosystem Surveillance plots (as of 2018). Black and dark purple plots indicate areas with high C3 cover; these areas are mostly found in the temperate habitats of Australia. In warmer northern habitats, increased percentage C4 cover is more common. (Credit: Sam Munroe)
Measuring C₄ and C₃ distribution across the country
The photosynthetic pathway dataset has been designed to conveniently work in tandem with ausplotsR, TERN’s R package that provides direct access to all of the data modules collected by TERN Ecosystem Surveillance.
The publication describing this new dataset includes helpful R code that shows scientists how to use ausplotsR and this dataset together to calculate % C4 and C3 cover at TERN plots across Australia.
These data and techniques have already been used to relate C4 cover in different taxa to changes in climate and local factors, as well as to assess the accuracy of different palaeobotanical techniques that estimate C4 plant cover in the ancient past.
“Although it is relatively new, this dataset has already proven to be a valuable resource for Australian researchers. We expect it will continue to enable work studying patterns in C4 and C3 plant occurrence, richness, and abundance at local to national scales.”
Associate Professor Ben Sparrow, TERN and The University of Adelaide
TERN intends to update the dataset as we increase our network of environmental monitoring plots and new species are recorded across the country.


