In this, our second popular science article from TERN, Prof. Andy Lowe discusses the measures and metrics used to track the state, condition and trajectory of our ecosystem services. Read on to find out how TERN data streams can provide accurate estimates or supporting information to monitor the stocks and changes in critical ecosystem services now and into the future.
Our natural and production landscapes, and the industries they support, are largely dependent on services provided by functioning ecosystems. These services are known as ecosystem services, benefits from nature or nature’s contributions to people (IPBES 2019; Díaz et al. 2018).
Functioning ecosystem naturally provision and replenish critical ecosystem services, such as clean water, health soil, nutrient supply and organic matter, as well as the cultural and health benefits to people (IPBES 2019). Biodiversity components are also vital to ecological function, acting as agents for pollination, seed dispersal, pest control and nutrient cycling. The network of biotic relationships and provision of services by multiple taxa enables ecosystem resilience.
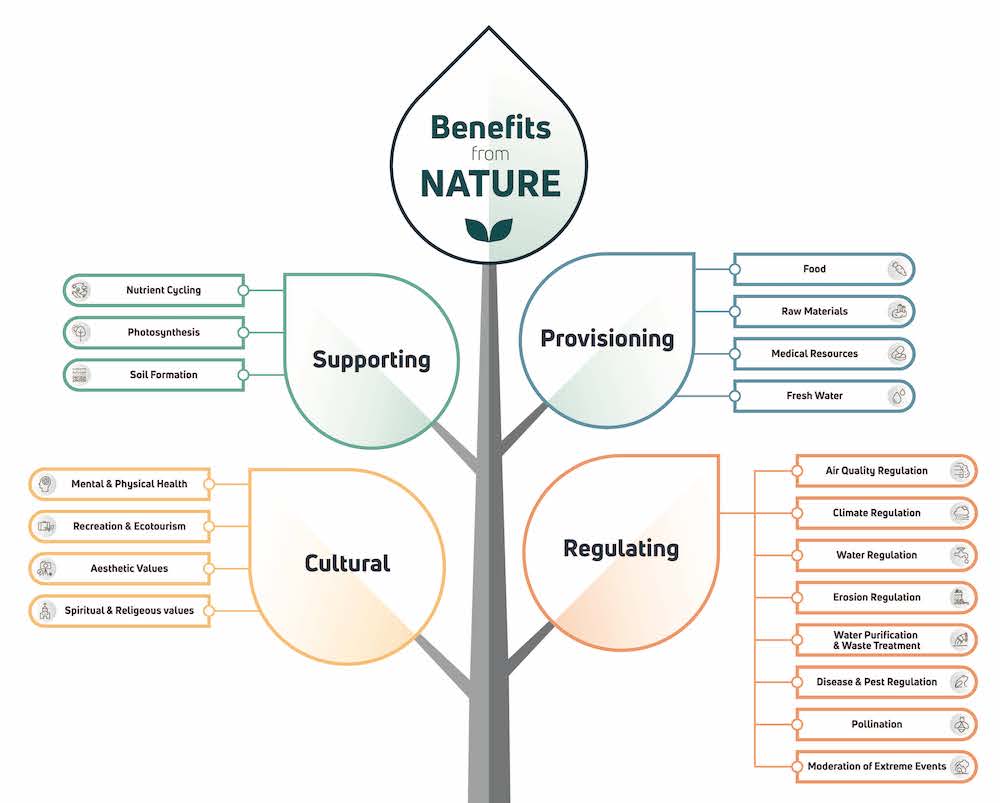
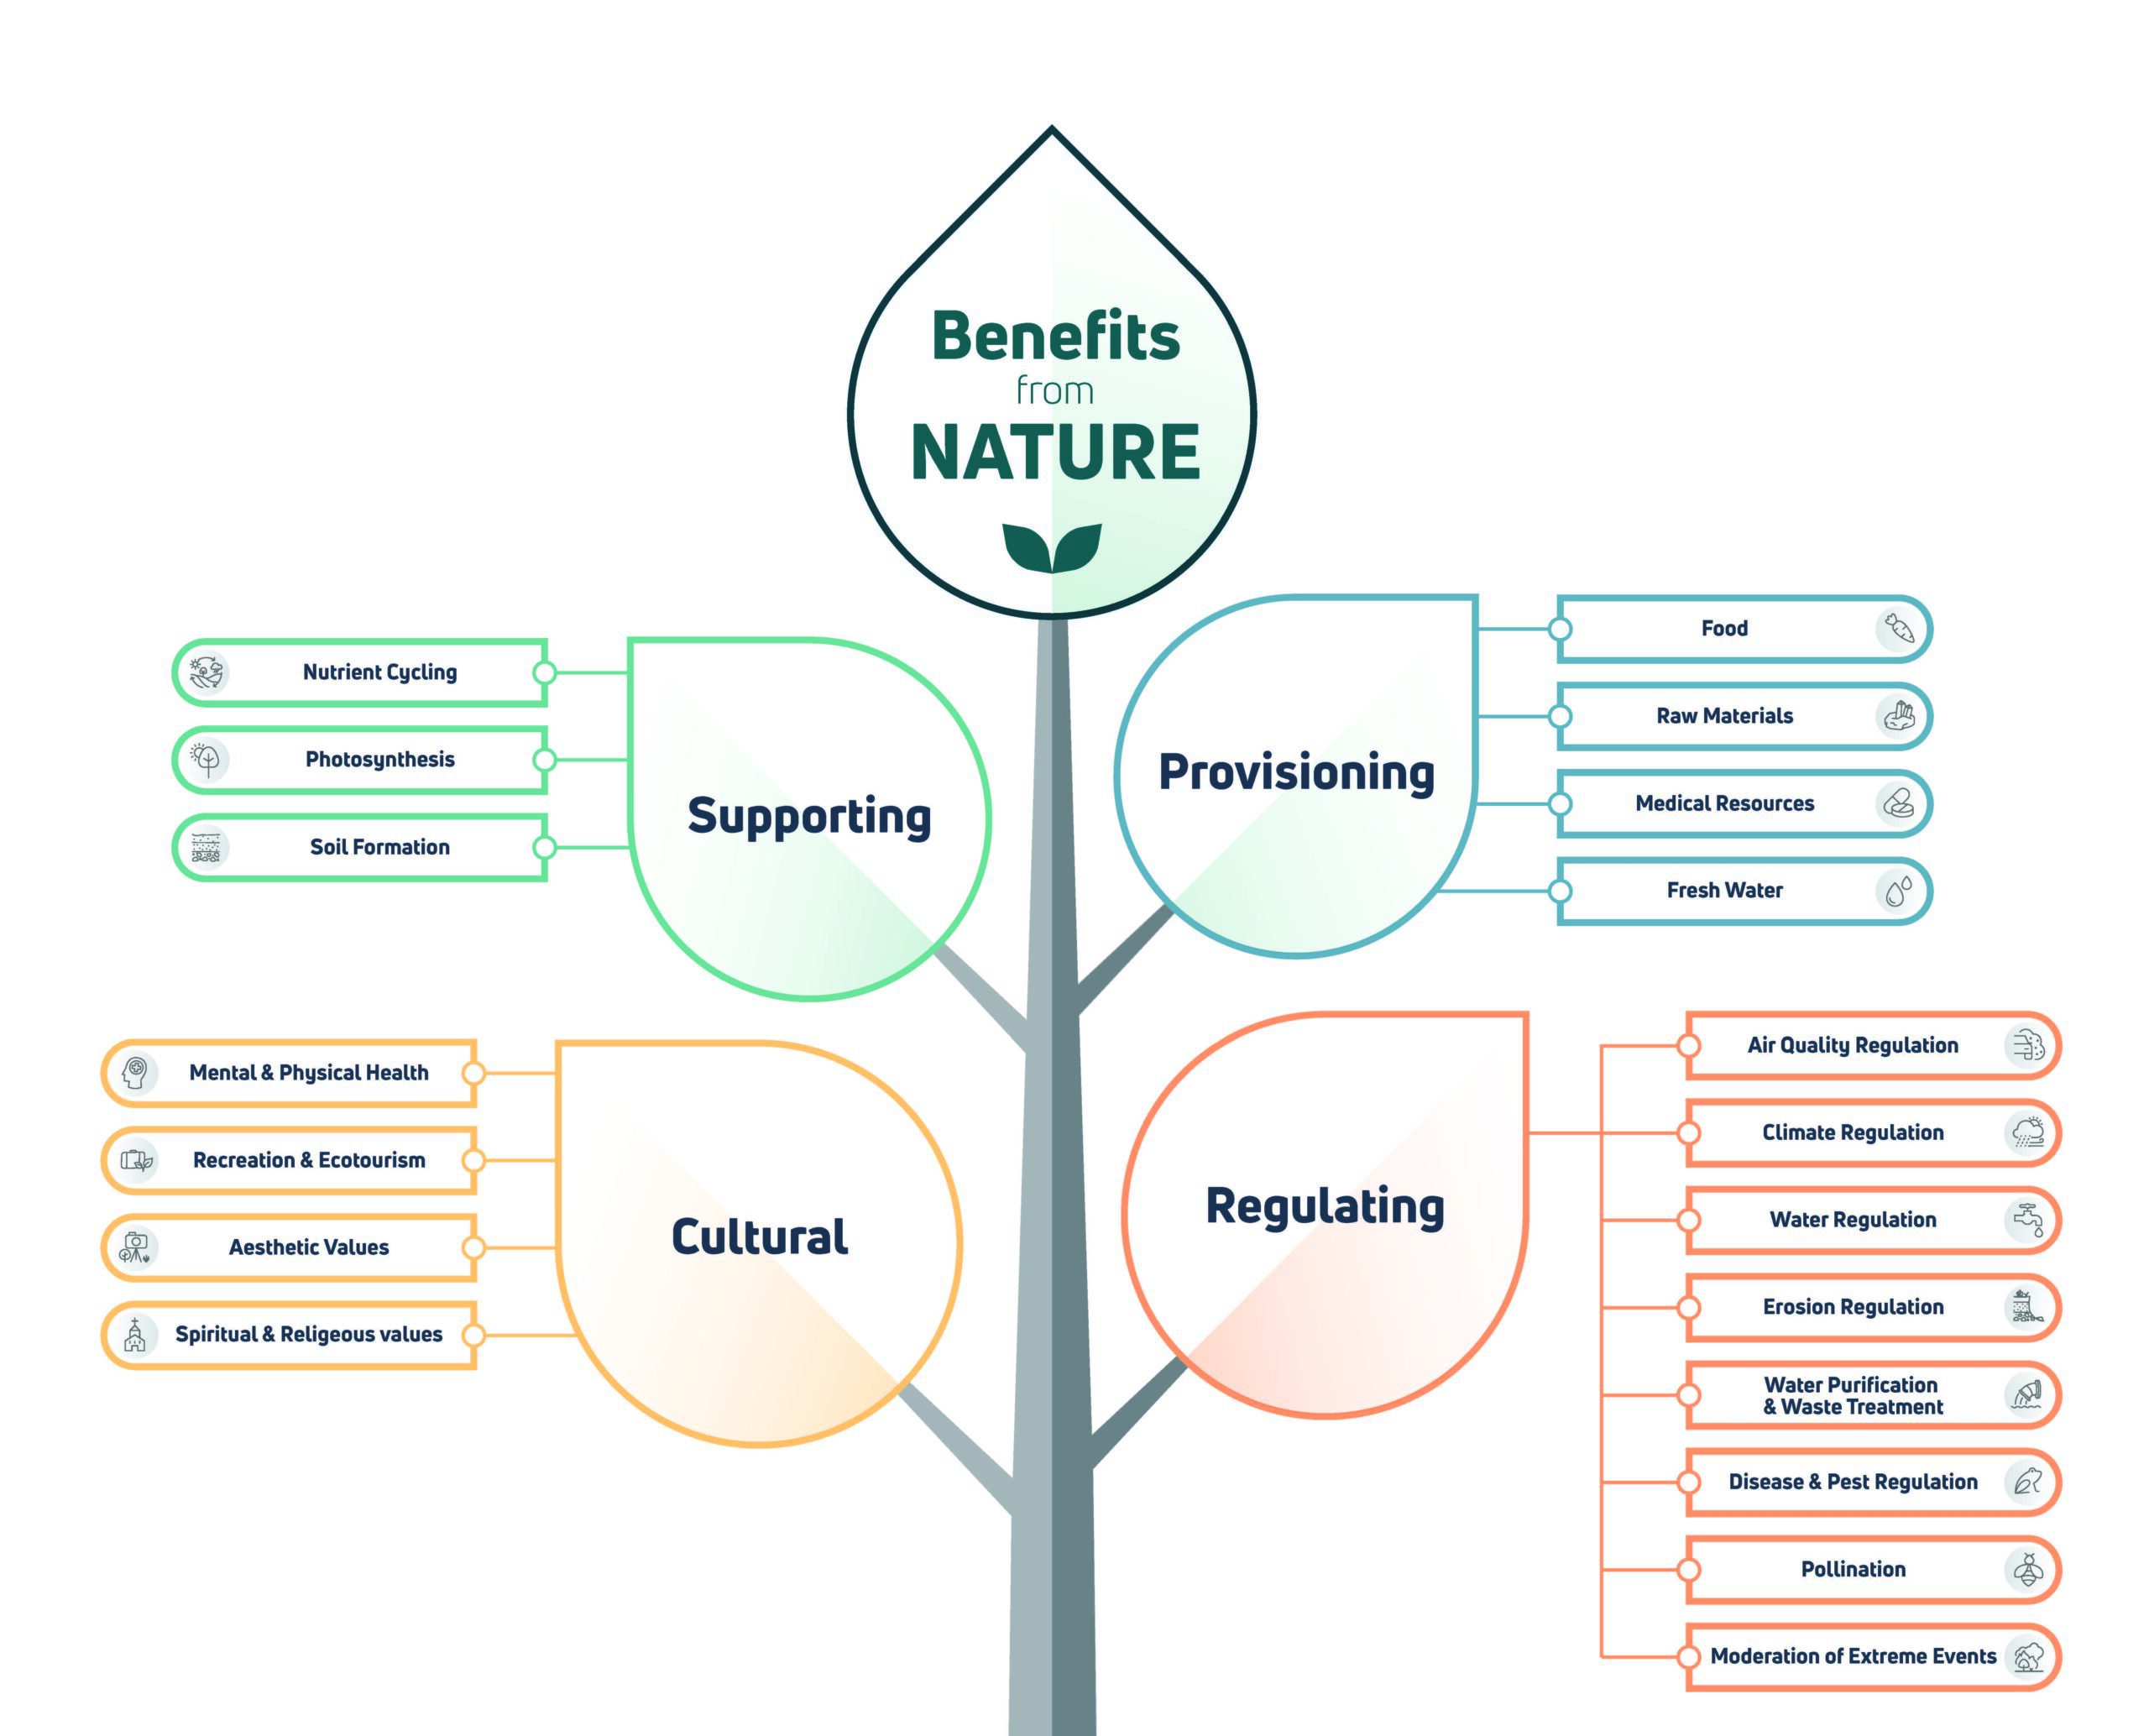
Ecosystem services are commonly divided into four categories:
- provisioning services – direct provision of products such as food, timber, fibre and medicines;
- regulating services – maintenance and control of natural processes such as floods, fire and climate;
- supporting services – nutrient cycling, pollination, water purification and soil fertility; and
- cultural services – aesthetic, spiritual or recreational assets.
A large body of research has established that the degradation of much of the world’s production landscapes and natural areas has resulted in a degradation of ecosystem services (IPBES 2019). In an appraisal of the condition of the world’s ecosystems, the ‘Millennium Ecosystem Assessment’ (MEA) found that agricultural landscapes were critical in maintaining ecosystem services and biodiversity. However up to 50% of global agricultural land, and 60% of ecosystem services, are degraded to some degree. Agricultural land use was found to be the main cause of land degradation (MEA 2005).
More recently, the ‘Intergovernmental Science-Policy Platform on Biodiversity and Ecosystem Services’ (IPBES 2019) estimated that ecological degradation currently impacts the well-being of over 3 billion people and is responsible for losses of over 10% of global annual gross product. In an analysis of 17 ecosystem services across 16 global biomes, Costanza et al. (2014) estimated that global land use change had resulted in the loss of ecosystem services valued at a cost of between 4.3 and 20.2 trillion US dollars a year.
So how do we track the state, condition and trajectory of our ecosystem services and what measures and metrics do we need to put in place to derive this information more easily?
There are a range of sources that can provide the basic information to track the stocks and changes in ecosystem services, but one largely untapped resource is the TERN data streams. A number of these TERN data streams can provide accurate estimates or supporting information and examples are described here.

Carbon – nationally important dataset
Building on the Australian Terrestrial Carbon Budget (Haverd et al 2013), estimates of carbon stocks in standing woody vegetation and soils can be derived from TERN Surveillance and Landscape data products (e.g. Bastin et al 2017, Sasaki et al 2016). Indeed, a continental scale carbon asset estimation could be derived (as suggested and estimated by Bastin et al 2018), which can be tracked over time.
What is critically important, and currently underestimated, are the carbon stocks in arid and semi-arid areas of Australia. In northern savannah regions, carbon uptake after extensive rain can be significant (and is large enough to influence global CO2 values), but equally large-scale fires cause rapid loss.
In semi-arid areas, carbon uptake and loss are slow with low volatility, which may make it a conservative system of carbon storage. However, with the shear spatial extent of these systems (approximately three quarters of Australia and 40% of the global terrestrial land masses), the potential for carbon update is significant (Baumber et al 2019, 2020).

Photosynthesis – nationally important dataset
There are a number of measures derived from satellite imagery that can be used to estimate the level of photosynthesis in ecosystems and change over seasons and inter-annually, for example during long term drought or climate cycles (e.g., ENSO). Such parameters include NDVI (normalized difference vegetation index – a measures of whether the target area contains green vegetation) and fractional vegetation cover produced, which are available through the TERN Landscapes portal, Joint Research Centre at University of Queensland and are now part of Geosciences Australia Digital Earth Australia (e.g. MODIS and Landsat).
There is a promising opportunity to link the developing Australian satellite capability with continuous measurement of Solar Induced Chlorophyll fluorescence (SIF), a measure that is directly (rather than indirectly as for the measures above) related to photosynthesis. Continental scale tracking and quantification of spatial and temporal photosynthesis could produce carbon uptake and loss maps in near real time.
Soil and Erosion – nationally important dataset
TERN’s Soil and Landscape Grid of Australia data product and the TERN Ecosystem Surveillance’s soil samples represent important continent-scale soil resources. Additionally, a national map of soils characteristics and texture (Malone & Searle 2021) is available at TERN through the “soil federator”.
The characterisation of soils, their physiochemical qualities, along with the component microbiome (e.g., BASE, Bisset et al 2016), potentially allows change in soil composition and erosion to be tracked over time. Recently this type of field and remote sensing information has been integrated to map soil degradation in some regions of Australia (Cowie et al 2019).
By combining remote-sensed ground condition with vegetation survey data and weather data, exposed areas prone to wind erosion can be identified. However, a critical gap is monitoring the deposition of dust (although there are some excellent regional monitoring tools e.g., Dust Watch in NSW). The fate and consequence of dust deposition in terms of land productivity, human health, water quality, aquatic productivity and soil properties at deposition sites are currently poorly understood and economically and environmentally undervalued.

Nutrient cycling – nationally important dataset
TERN Ecosystem Processes provides comprehensive measurement of the carbon, nitrogen, water and nutrient cycling that occurs between soil, vegetation and the atmosphere for a range of representative biomes. This information is important for understanding the stocks and flows of these components in ecosystems, which improves our modelling of their function and relationship to global cycling.
However, at a continental scale, direct estimation of nutrient cycling is relatively minimal – with just a few sites sampling nitrogen fluxes (e.g., National Land and Water Resources Audit). There is a big gap in the systematic tracking of nutrient status across Australia, which TERN could help fill. But in terms of targeting the collection of this information, while spot measures are useful, it is perhaps more important to identify where limits to productivity and threats to ecosystems exist from nutrient cycling – for example agricultural nutrient runoff onto the Great Barrier Reef.

Pests and weeds – contributing dataset
TERN Ecosystem Surveillance’s plot data allows the current composition of weed plants to be estimated across the continent (Martín-Forés et al. 2017). Revisits to these sites will allow the monitoring and change in weed cover to be tracked over time.
Marine resources – contributing dataset
A mangrove data portal has been developed by TERN and is operationalised through Geoscience Australia. This information is useful for monitoring stocks and changes in ecosystem services provided by mangroves, e.g., fish nurseries and blue carbon.
Pollination – contributing dataset
Collection of insects and identification of bird species at TERN Ecosystem Processes sites, combined with high-throughput DNA barcoding analysis, represent ways to provide detailed pollination service assessment. Other data sets include the large-scale malaise trapping and DNA barcoding studies undertaken by the International Barcode of Life Initiative and which have been rolled out on a global scale.

Water – contributing dataset
Surface and groundwater flows are estimated at some TERN EcosystemProcesses sites. When this information is combined with other regional, state and federal environmental monitoring programs, water stocks, flows and quality can be assessed.
It is increasingly evident that as drought periods increase in intensity, frequency and longevity, ecosystems are becoming increasingly dependent on groundwater resources.
The knock-on consequence of changing drought regimes will be long-term compositional shifts in ecosystems. Connecting ecosystem response to groundwater resource availability will improve our understanding of these systems and will be the only way of foreshadowing and adapting to these changes.
The exchange of water vapour between soil, vegetation and the atmosphere is estimated at TERN Ecosystem Processes sites, and is important for understanding the rate of water loss (transpiration) from plants.

Medical resources – contributing dataset
The bioactive potential of soil microbes has been assessed at representative TERN Ecosystem Surveillance sites to understand how best to sample this variation at a national scale (Lemetre et al 2017).

Cultural – potential contributing datasets
Perhaps the biggest gap in ecosystem service information for Australia is around cultural contributions, such as spiritual, aesthetic, recreational and mental/physical health.
There is a major opportunity to develop ecosystem cultural and human health proxies. For example, vegetation intactness was found to be correlated with respiratory health in South Australia (Liddicoat et al 2018), and mapping pollen type and load is an important ecosystem service related to mental and physical health.
Towards integration into environmental accounts
The reporting of the state and trajectory of ecosystem services together with the value of this asset base is an important future step that needs to be incorporated into State of the Environment reporting in Australia.
TERN can play its role and has several nationally important and supporting datasets and systems that can be combined into this accounting exercise. However new work will also be required to fill several important gaps, particularly around cultural ecosystem services where community and landholder cultural values and perceptions need to be integrated (e.g., Martín-Forés et al., 2020).
- Article by Andrew Lowe.
- With thanks to Wayne Meyer, Irene Martin, Alex Mason and Graciella Metternicht for providing input and comments on the text.
References:
Bastin J-F, Berrahmouni N, Grainger A, Maniatis D, Mollicone D, Moore R, Patriarca C, Picard N, Sparrow B, Abraham EM, Aloui K, Atesoglu A, Attore F, Bassüllü Ç, Bey A, Garzuglia M, García-Montero LG, Groot N, Guerin G, Laestadius L, Lowe AJ, Mamane B, Marchi G, Patterson P, Rezende M, Ricci S, Salcedo I, Diaz AS-P, Stolle F, Surappaeva V, Castro R (2017) The extent of forest in dryland biomes. Science 356:635-638.
Bastin J-F, Finegold Y, Garcia C, Gellie N, Lowe AJ, Mollicone D, Rezende M, Routh D, Sacande M, Sparrow B, Zohner CM, Crowther TW (2018) Response to comments on “The global tree restoration potential”. Science 366:6463.
Baumber A, Waters C, Cross R, Metternicht G, Simpson M (2020) Carbon farming for resilient rangelands: people, paddocks and policy. The Rangeland Journal 42:293-307. https://www.publish.csiro.au/rj/rj20034
Baumber A, Metternicht G, Cross R, Ruoso LE, Cowie AL, Waters C (2019) Promoting co-benefits of carbon farming in Oceania: Applying and adapting approaches and metrics from existing market-based schemes. Ecosystem Services 39: 100982. https://www.sciencedirect.com/science/article/pii/S2212041619302396?casa_token=ZtKAt1AFhJYAAAAA:ZFQ5uPOjFq-YS-KqJP1SJxNV6lto6NU678i9bTzoPx39_mb3mWgLD0HdN3EjfuGdblr52A
Bissett A, Fitzgerald A, Meintjes T, Mele PM, Reith F, Dennis P, Breed M, Brown MV, Brown B, Brugger J, Byrne M, Caddy-Retalic S, Carmody B, Coates D, Correa C, Ferrari B, Gupta VVSR, Hamonts K, Haslem A, Hugenholtz P, Karan M, Koval J, Lowe AJ, Macdonald S, McGrath L, Martin D, Morgan M, North K, Paungfoo-Lonhienne C, Pendal E, Phillips L, Prizl R, Powell JR, Ragan M, Schmidt S, Seymour N, Snape I, Stephen JR, Stevens M, Tinning M, Williams K, Yeoh YK, Zammit YK, Young A (2016) Introducing BASE – The Biomes of Australian Soil Environments soil microbial diversity database. GigaScience 5: 21.
Cowie AL, Waters CM, Garland F, Orgill SE, Baumber A, Cross R, O’Connell D, Metternicht G (2019) Assessing resilience to underpin implementation of Land Degradation Neutrality: A case study in the rangelands of western New South Wales, Australia. Environmental Science & Policy 100:37-46.
Díaz S, Pascual U, Stenseke M, Martín-López B, Watson RT, Molnár Z et al Shirayama Y (2018) Assessing nature’s contributions to people. Science 359:270-272.
Haverd V, Raupach MR, Briggs PR, Canadell JG, Davis SJ, Law RM, Meyer CP, Peters GP, Pickett-Heaps C, Sherman B (2013) The Australian terrestrial carbon budget. Biogeosciences 10:851-869
Lemetre C, Maniko J, Charlop Powers J, Sparrow B, Lowe AJ, Brady SF (2017) Bacterial natural product biosynthetic domain composition in soil correlates with changes in latitude on a continent-wide scale. Proceedings of the National Academy of Sciences 114:11615-11620
Liddicoat C, Bi P, Waycott M, Glover J, Lowe AJ, Weinstein P (2018) Landscape biodiversity correlates with respiratory health in Australia. Journal of environmental management 206:113-122
Lucas R, Mueller N, Siggins A, Owers C, Clewley D, Bunting P, Kooymans C, Tissott B, Lewis B, Lymburner L, Metternicht G (2019) Land cover mapping using digital earth Australia. Data 4:143.
Malone B, Searle R (2021) Updating the Australian digital soil texture mapping (Part 2*): spatial modelling of merged field and lab measurements. Soil Research 59:435-451. https://doi.org/10.1071/SR20284
Martín-Forés I, Magro S, Bravo-Oviedo A, Alfaro-Sanchez R, Espelta JM, Frei T, Valdes-Correcher E, Rodriguez Fernandez-Blanco C, Winkel G, Gerzabek G, Gonzalez-Martinez SC, Hampe A, Valladares F (2020) Spontaneous forest regrowth in South-West Europe: Consequences for nature’s contributions to people. People and Nature 2:980–994.
Martín-Forés I, Guerin GR, Lowe AJ (2017) Weed abundance is positively correlated with native plant diversity in grasslands of southern Australia. PLoS ONE 12(6): e0178681. https://doi.org/10.1371/journal.pone.0178681
Metternicht G, Mueller N, Lucas R (2020) Digital Earth for Sustainable Development Goals. Manual of Digital Earth, p.443. https://library.oapen.org/bitstream/handle/20.500.12657/23172/1006981.pdf?sequence=1#page=449
Metternicht G, Lucas R, Bunting P, Held A, Lymburner L, Ticehurst C (2018) Addressing mangrove protection in Australia: the contribution of earth observation technologies. In IGARSS 2018-2018 IEEE International Geoscience and Remote Sensing Symposium (pp. 6548-6551). IEEE. https://ieeexplore.ieee.org/abstract/document/8517518/?casa_token=fmRZLZPMiysAAAAA:C3W8B35YxyNg-m0jySAUdooKiuV_hkIqTjic_0ok3zf0Hx5ERgNEkDNqizDuzX7C93Abvw
Sasaki N, Chheng K, Mizoue N, Lowe AJ (2016) Forest reference emission level and carbon sequestration in Cambodia. Global Ecology and Conservation 7, 82-96