

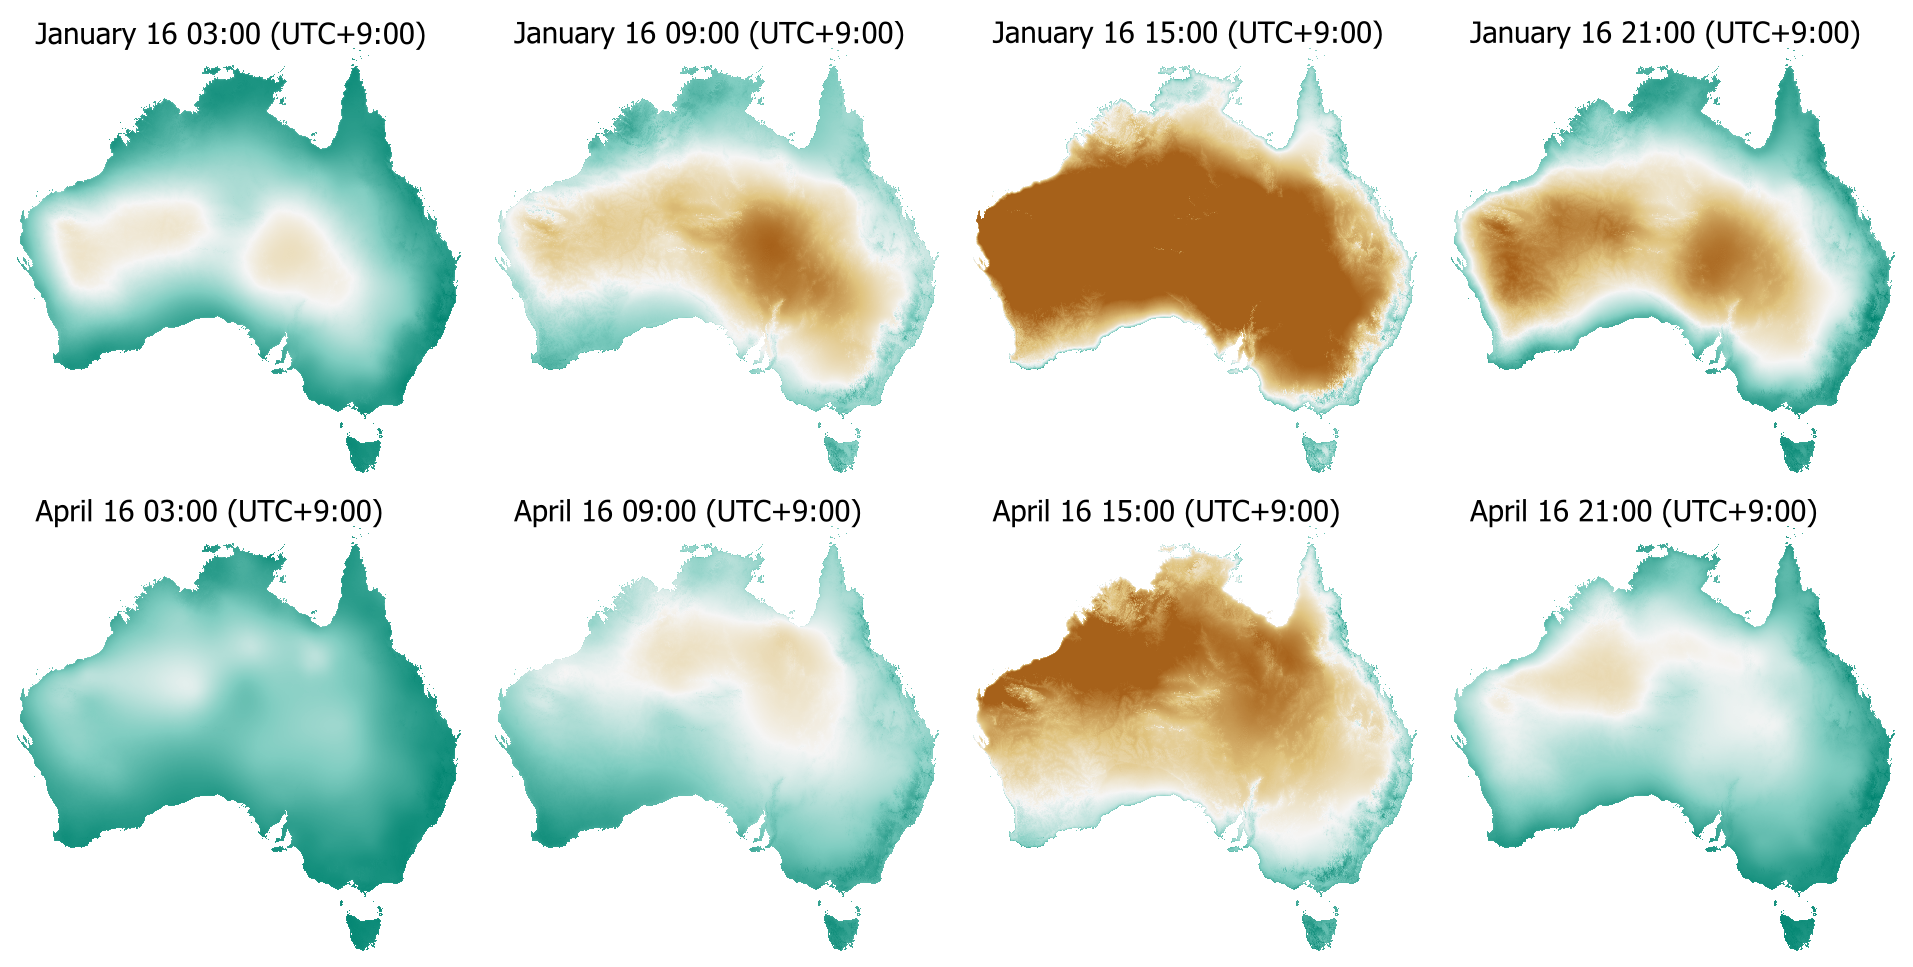
A TERN-CSIRO Environment team has led the development of the first datasets of hourly air temperature, actual vapour pressure and vapour pressure deficit at 1 km resolution for all of Australia using hourly Bureau of Meteorology observations. By combining high temporal frequency with high spatial resolution, these new data products provide a resolution “sweet spot” that will facilitate environmental, hydrological and agricultural research anywhere on the continent.
Ambient near-surface air temperature and the moisture held in that air play a central role in the functioning of terrestrial ecosystems. By paying close attention to their fluctuations — and the way living systems respond — we can learn a great deal about critical ecosystem processes.
That close attention begins by collecting time-series data. For ambient air temperature this involves using a thermometer to measure near-surface air temperature at ground-based meteorological stations. Measuring air moisture — or humidity — is a bit more complicated and is performed using an instrument called a hygrometer to measure actual vapour pressure. This is the contribution of water vapour to the total atmospheric pressure.
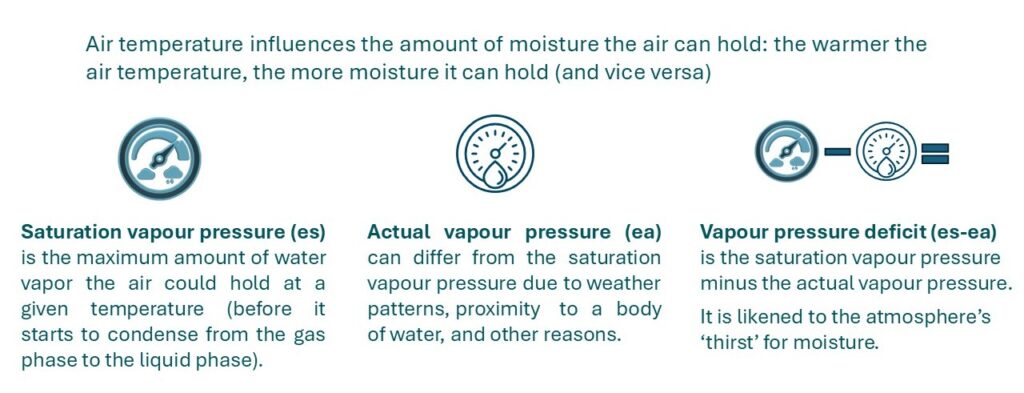
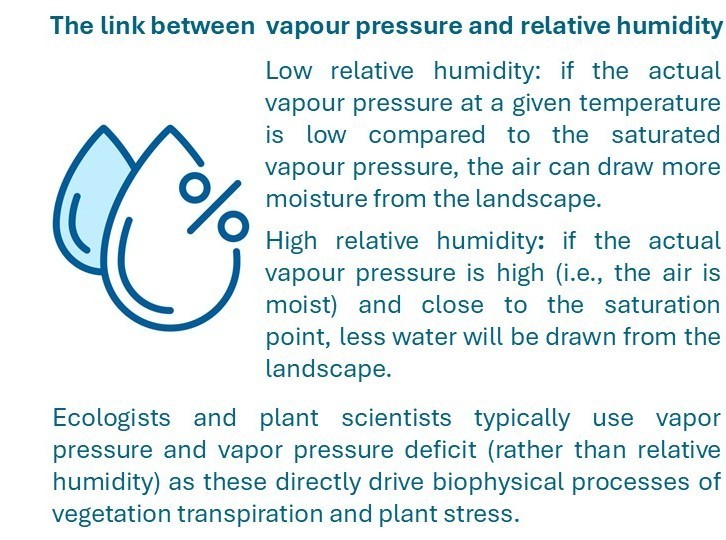
Moreover, once you know both the near-surface air temperature and the actual vapour pressure at a particular location and time, it’s possible to calculate vapour pressure deficit, which is a measure of the atmospheric demand for water or how much water the air could hold at a specified temperature.
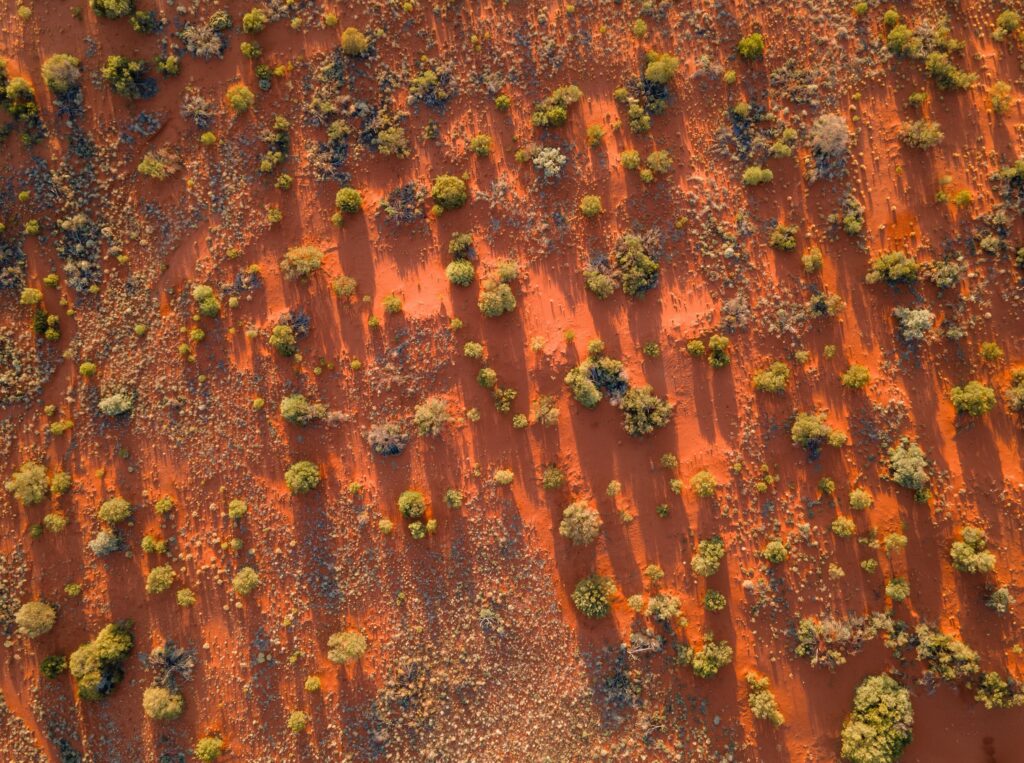
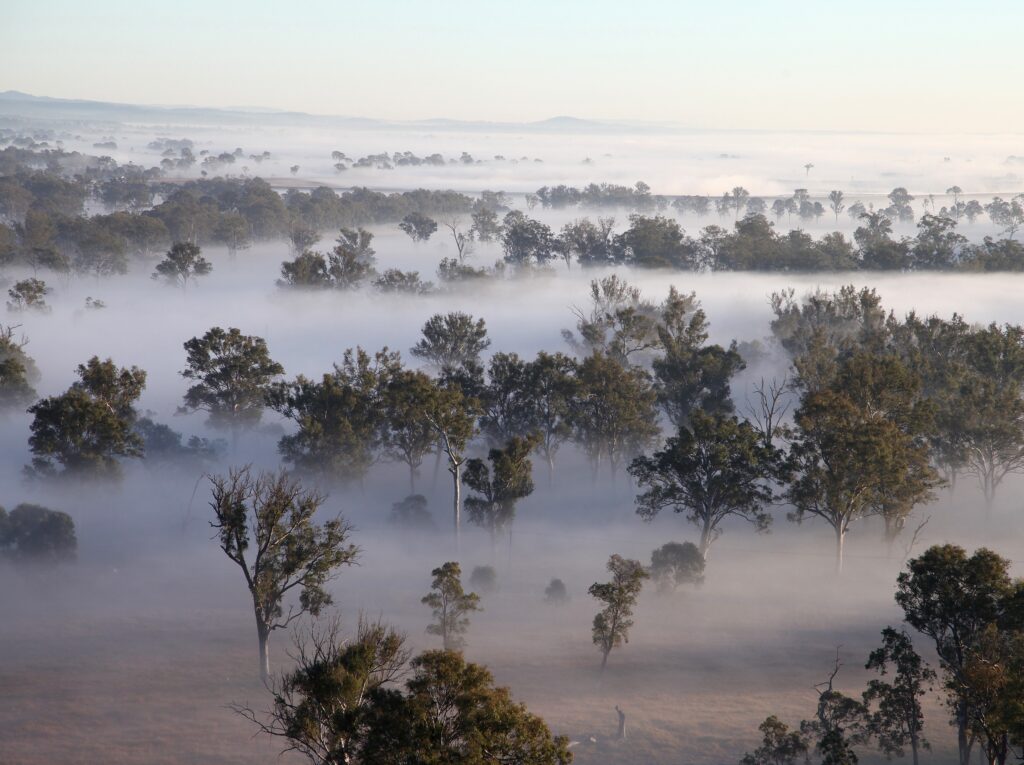
images via Adobe iStock
(credits left: ourtravelsfromabove right: jacquimartin)
“Near-surface air temperature, actual vapour pressure and vapour pressure deficit are essential climate variables,” says Dr Stephen Stewart, a geospatial research scientist at CSIRO Environment. “Tracking their variability over time and from one environment to another is extremely useful for studying and predicting many biophysical phenomena, from agricultural productivity to the geographic distribution of species and communities.”
“These variables are also incredibly important for quantifying energy and water balances,” adds Dr Tom Van Niel, a senior scientist at CSIRO Environment Perth and TERN Landscapes Earth Observation Science Advisor. “They are critical for understanding many processes in both natural and managed systems.”
For example, these metrics help researchers analyse evapotranspiration by plants and the soil, which helps reveal how a vegetation community uses water and under what conditions it experiences water stress. In agricultural settings, it can reveal important insights into crop productivity. Observations of air temperature, actual vapour pressure and vapour pressure deficit also support the analysis of bushfire dynamics and fire risk and inform studies on the biogeographic distribution of living species under climate change. These data are also invaluable for hydrological, ecological, and atmospheric models which identify environmental trends and predict risks to natural systems, food security and human health.
The temporal frequency of the data matters, says Dr Tim McVicar, who leads the Remote Sensing Hydrology Team in the Future Water Program at CSIRO Environment. “Daily meteorological grids are available for over 100 years for Australia, and we can use those to monitor seasonal changes such as the ‘wet’ and dry seasons in Australia’s ‘Top End’ around Darwin, and we can also use them to monitor climate variability, including droughts and floods, as well as climate change,” he explains. “However, the daily time-step misses important details that we can only ‘see’ if we have sub-daily data.”
A lot can change in a day: why hourly data matters
For any living organism, the impacts of extreme heat, cold, and humidity depend on how intense the conditions are, how long they last, and how well an organism can regulate its physiology.
“It’s important to recognise that every living organism has an upper and lower threshold of environmental conditions beyond which they can’t survive,” says Tim. In certain conditions, the differences between good health, morbidity, or even death can occur within the space of a few hours, he explains. “Things can go off the rails pretty quickly.”
For example, if the maximum temperature (Tmax) for a given day is 38 °C, a healthy, acclimatised human at rest who is exposed to this Tmax for one hour will experience heat stress. If that Tmax lasts for five hours the amount of heat stress increases substantially.
A person’s physiological response also depends on the amount of moisture in the air. If air moisture is low, perspiration provides a cooling effect because water on the skin will evaporate into the surrounding air. This is due to the significant difference in actual vapour pressure between the wet skin and the dryer air, says Tim. “For evaporative cooling to work, you need to have that gradient in vapor pressure.”
In extremely humid conditions this evaporative cooling no longer works as well, because the air is so saturated with water vapour there’s nowhere for the droplets of perspiration to go. “That’s why, when you combine high air temperatures with high humidity, it quickly becomes a risky health issue in a short period of time.

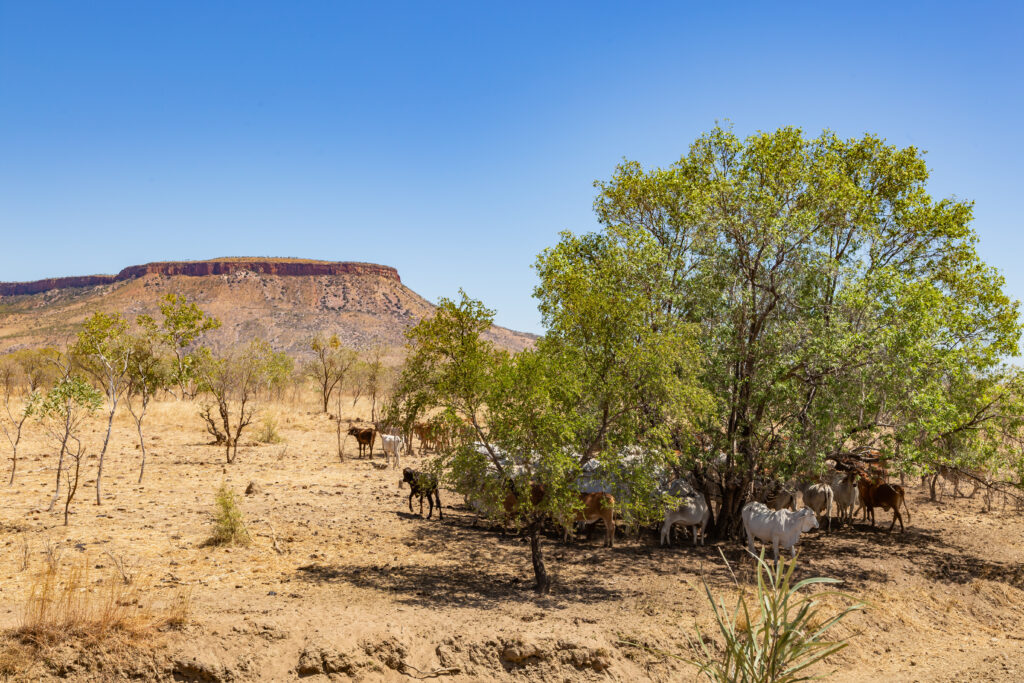
A review in The Lancet Planetary Health found that Preferable temperatures for humans, livestock, fish, and agricultural crops range from 17°C to 24°C.
“Stress temperature thresholds are lower when humidity is higher. However, extended exposure to temperatures above 25°C with high humidity can cause heat stress in many organisms. Short exposures to temperatures above 35°C with high humidity, or above 40°C with low humidity, can be lethal.”
(image credits: top MelissaMN; bottom Charnchai saeheng; both via Adobe iStock)
credit Tammy Walker, Adobe iStock
Just as rapid sub-daily changes in temperature and humidity can lead to severe health impacts for human populations, they can also have detrimental impacts on wildlife, vegetation and whole ecosystems. For example, prolonged periods of extreme heat can cause severe heat stress and dehydration in greater gliders, potentially resulting in elevated mortality rates and local population declines.
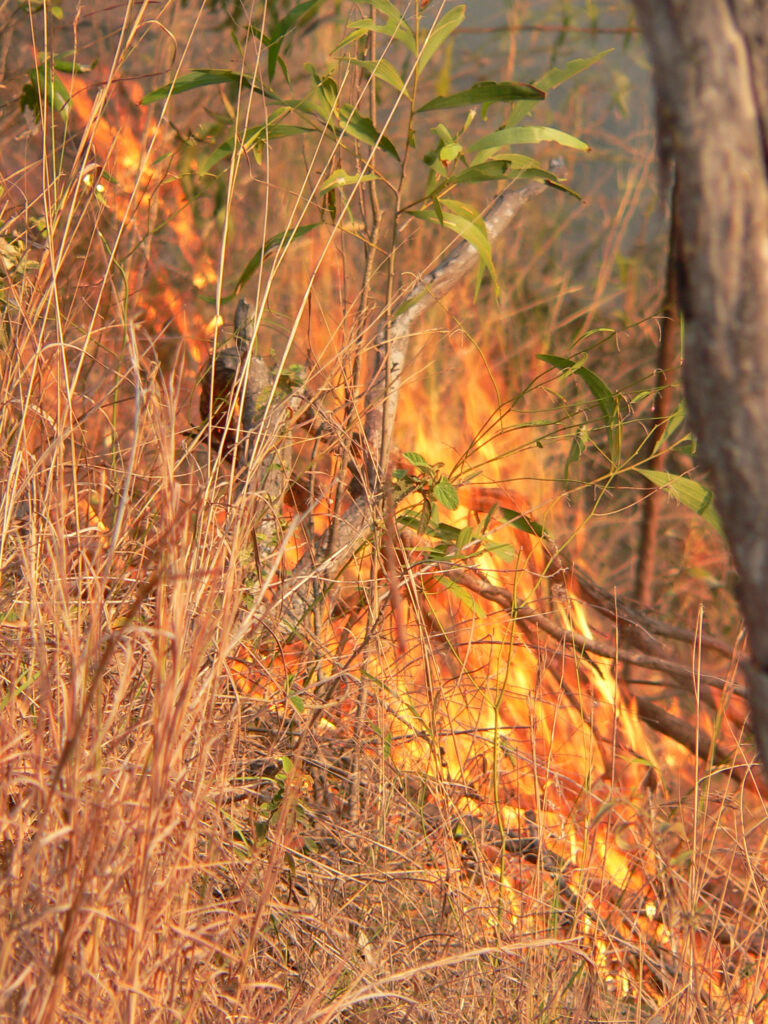
Elsewhere a sudden increase of vapour pressure deficit, often associated with strong winds coming from semi-arid and arid inland Australia, intensifies drying of leaf litter, which heightens the risk of bushfire, if there is a source of ignition.
Indeed, as the climate changes, ecosystems are increasingly exposed to sub-daily variations in temperature and humidity that they are not acclimatised to. It’s also a huge agricultural issue. Maize, for example, is a critical part of the global food supply and as the authors of this recent paper on heat stress in maize, explain:
“Short-term extreme heat during flowering can amplify yield loss, but such transient events — often lasting only hours — are frequently masked by daily mean temperatures, leading to underestimated risks. Hourly temperature monitoring has shown that brief heat spikes during critical stages can substantially reduce maize yield, emphasizing the need for fine-scale assessment.”
“There’s still a great deal we don’t know about how many different living systems will respond to shorter term extreme weather,” says Stephen. “Daily and longer-term data play an important role in studying these dynamics, but if we want to understand and predict the impacts of rapid sub-daily changes in air temperature and moisture, we need such sub-daily data to incorporate into our analyses, understanding and knowledge.”
Moreover, air temperature and moisture can change significantly from one location to another due to landscape topography, proximity to water, brief weather events and more, he explains. “This means we also need high spatial resolution for that data to account for all these different variations, especially topography, in a country as big and as climatically diverse as Australia.”
The resolution challenge
Unfortunately, there are often trade-offs between high spatial resolution and high temporal frequency in climatological datasets. This has limited the development of suitable high-spatial-resolution hourly products providing granular data across both domains.
Temporal challenges
Most available datasets for air temperature and moisture provide daily metrics: often a daily average value and values of daily extremes (i.e., the maximum and minimum). “This doesn’t tell you precisely when the maximum or minimum air temperatures occurred, and the daily average hides all the hourly fluctuations,” explains Stephen.
It’s possible to use daily datasets to estimate finer grain hourly data. “For example, it’s likely the minimum temperature occurred just before sunrise and that the maximum occurred mid-afternoon,” he says, “but these are assumptions that may introduce errors into the models that use them.”
Spatial challenges
Existing data for near-surface air temperature and vapour pressure for Australia are often spatially coarse.
Furthermore, the observations that underpin these data are not evenly distributed and tend to cluster tightly in some regions and are incredibly sparse in others.
“We have a lot of observations in some places, especially in southeastern Australia, which is great,” says Stephen, “but as we want to manage all Australian landscapes, we need to develop topographically and distance-from-coast informed geospatial interpolation methods that account for important sub-daily processes.”
The TERN-CSIRO Environment team has risen to the challenge, developing Australia-wide, 1 km resolution and hourly frequency data grids that researchers need to study local, regional and continental scale dynamics. They recognised that meeting this need would also benefit their own remote-sensing research with TERN’s ethos of ‘data as infrastructure’ making it publicly available via TERN Data Discovery website.
Tim and his colleagues regularly use high-resolution, hourly data from Japan’s Himawari-8/9 satellite, which enables them to study critical water, energy and atmospheric processes including vegetation drought stress, as well as solar irradiance and cloud cover.
“We knew that if we could develop near-surface air temperature and vapour pressure datasets with high spatial and temporal granularity, it would improve location-specific interpretation of the 10-minute data provided by Himawari covering all of Australia.”


12 km
5 km
1 km
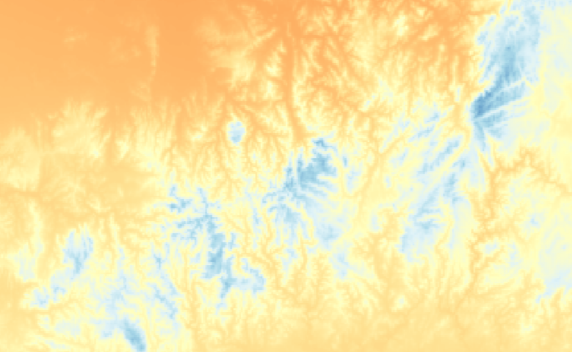
Resolution matters: Higher-resolution air temperature models (1 km) can resolve finer environmental gradients that are lost in lower-resolution averages (5 km, 12 km), which is particularly important in regions with complex topography. Credit: Stephen Stewart, CSIRO Environment.
Building a new dataset
In recent decades the number of Australian Bureau of Meteorology (BoM) operated meteorological stations that collect hourly data has steadily increased. “We have included over six-hundred weather stations collecting sub-daily data across the continent,” Stephen explains. “This presented a chance to build the granular dataset that we and others needed.”
With an adequate number of BoM data collection points across Australia, he and his colleagues reasoned they could implement advanced geostatistical modelling techniques (accounting for both topographic and distance from coast changes as a function of day-of-year and time-of-day as the ‘sea-breeze’ is a warm-season late afternoon / early evening phenomena) to accurately estimate hourly air temperature and actual vapour pressure data at high spatial resolution right across the Australian continent.
With support from TERN Landscapes, with Dr Tom Van Niel managing a suite of 10 Earth Observations TERN work packages (aka projects), the project team rolled up their proverbial sleeves and got to work.
The first step was gaining access to the air temperature and actual vapour pressure data recorded hourly at 621 BoM automatic weather stations (AWS). Each AWS transmits the data to BoM Headquarters in Melbourne, which then makes the data available to the TERN-CSIRO Environment team.
With these data it was possible to also generate hourly vapour pressure deficit grids across Australia, derived using the interpolated actual vapour pressure and near-surface air temperature grids. In so doing they systematically produced a continental scale data grid at 1 km resolution. “It’s a pixel-by-pixel, all-of-Australia dataset representing important daily-to-hourly time-step variability,” says Stephen.
The team then validated their new hourly data products using observations from 28 independent TERN (CosmOz and OzFlux) sites, which confirmed that their spatially interpolated data compared extremely well against field measurements. For full details, and to read about other forms of validation, including comparisons to regional (BoM’s BARRA-R) and global (ERA5-Land) reanalysis output, please see Stewart et al (2024).
The dataset was released in August 2026 and is now available via the TERN Data Portal. These data can be programmatically accessed from the TERN data portal and used directly in process and/or statistical models,” says Tom.
Click the following links to go each data product:



The TERN-CSIRO Environment team is already using the dataset in its own models and is happy with the improvements. “The finer temporal frequency and spatial resolution of these data enables our models to more accurately represent the ecosystem processes we’re interested in,” says Tom.
“These new TERN data products provide a “sweet spot” for environmental, hydrological and agricultural research anywhere in Australia.”
They’re also finding that the high-resolution surfaces provided by the 1 km resolution continental grids are much better suited for supporting analysis of the Himawari remote sensing data. For example, in 2025 the team published a new ‘cutting edge’ approach, using the differences between the Himawari land surface temperature and the air temperature grids, developed with BoM observations, to monitor and forecast vegetation drought as mentioned in an earlier TERN newsletter. This will be useful for understanding bushfire hazard across Australian landscapes.
“It’s much more useful,” says Tim. “Access to high spatial resolution, sub-daily data means it is now possible to study the critical biophysical dynamics that play out over the course of a single day across the entire Australian continent.
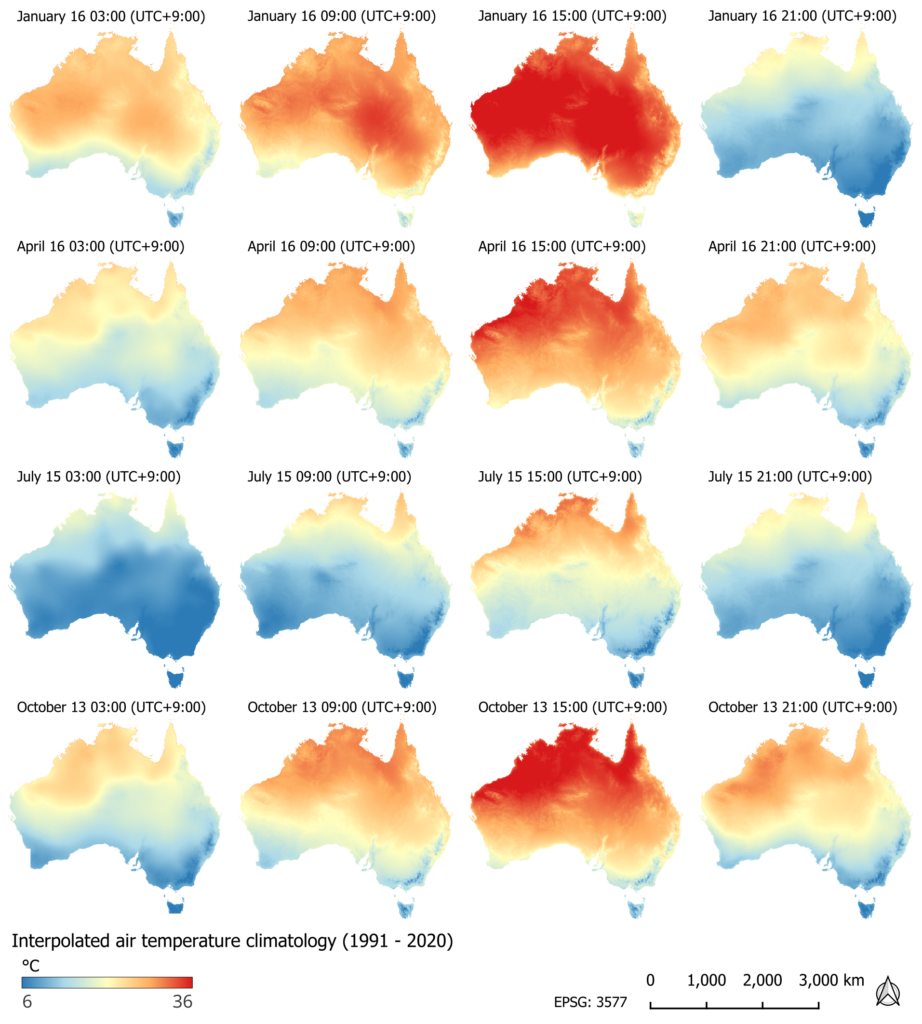
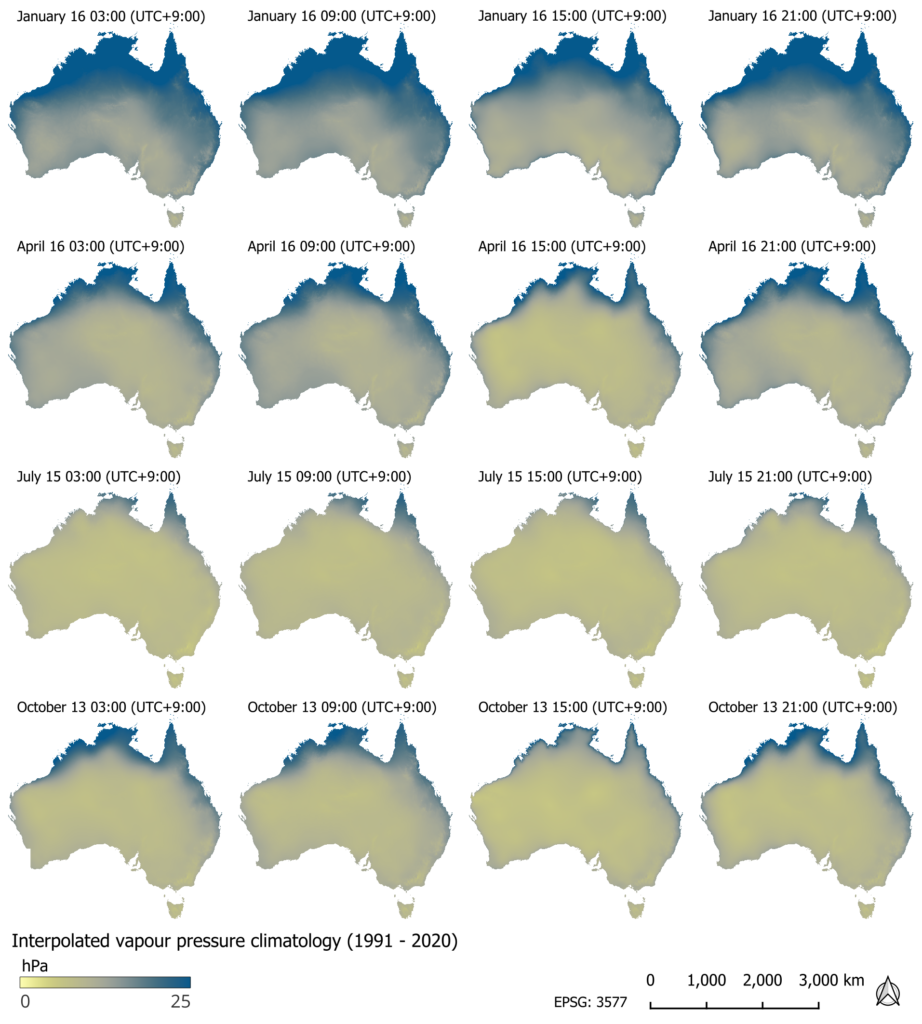
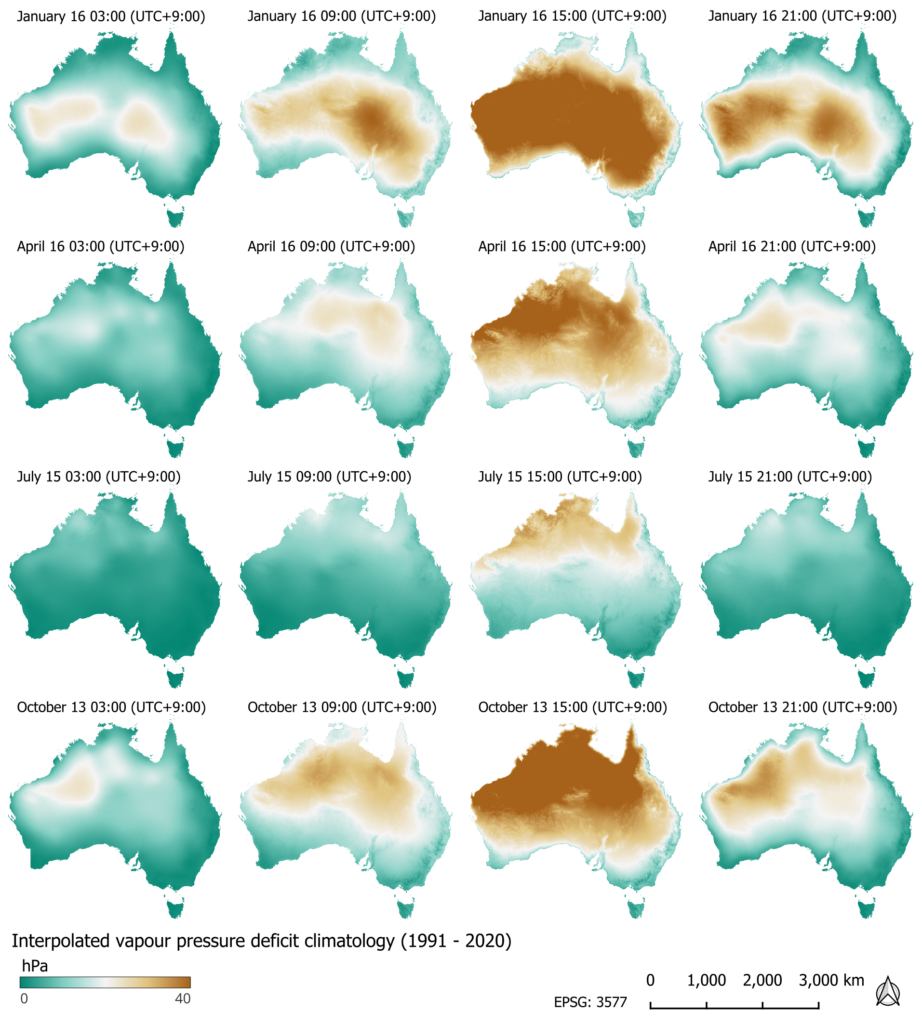
Seasonal (rows) air temperature (top left 4 x 4 array), vapour pressure (top right 4 x 4 array) and vapour pressure deficit (bottom left 4 x 4 array) climatologies (1991-2020) across Australia at four times-of-day (columns). Credit: Stephen Stewart, CSIRO Environment.
Side-by-side animations showing the spatio-temporal dynamics of vapour pressure deficit (VPD) over Australia at hourly time intervals from 21 to 24 Dec 2022. On left: time-lapse spatial maps. On right: hourly time series chart of vapour pressure deficit at Darwin (blue) and Sydney (orange). For the right image, VPD was higher in Darwin than Sydney during mid-day hours of 21 Dec 2022 (3-4 second mark). But from 22 Dec 2022, VPD substantially decreased in Darwin due to the BoM-reported summer monsoon onset, while Sydney showed progressively higher VPD (11 second mark onwards). Credit: Dejun (Jack) Cai, CSIRO Environment.

References:
Stewart, S.B., McVicar, T.R., Van Niel, T.G. and Cai, D. (2024) Continental scale spatial temporal interpolation of near-surface air temperature: Do 1 km hourly grids for Australia outperform regional and global reanalysis outputs? Climate Dynamics. 62(10), 9971–10002, doi:10.1007/s00382-024-07340-w
Feature image: Vapour pressure deficit climatologies (1991-2020) during mid-summer and mid-autumn (rows) across Australia at four times-of-day (columns). Credit: Stephen Stewart, CSIRO Environment.