News

People using TERN: Andrew Edwards

A research fellow from the Darwin Centre for Bushfire Research is using TERN delivered data to map fire severity across the Top End for more informed regional fire management and more accurate national carbon accounting.

Fire severity mapping is essential for biodiversity conservation and greenhouse gas emission monitoring and assessment, says Dr Andrew Edwards of Charles Darwin University’s Darwin Centre for Bushfire Research.

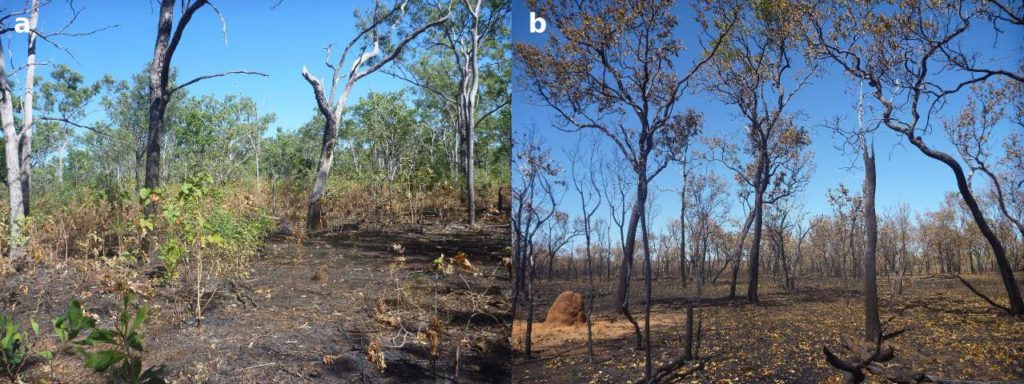
“It also provides land managers with vital information regarding the effects of their imposed fire management.”

“However, until recently we haven’t had the tools and methods for remotely mapping fire severity and have instead relied on coarse assessments based on fire seasonality,” Andrew says.

To fill this information gap Andrew has developed an accurate and efficient method of mapping the severity of fires in Australia’s tropical savanna ecosystems, which cover approximately 25%, or 1.9 million km2, of the continent.

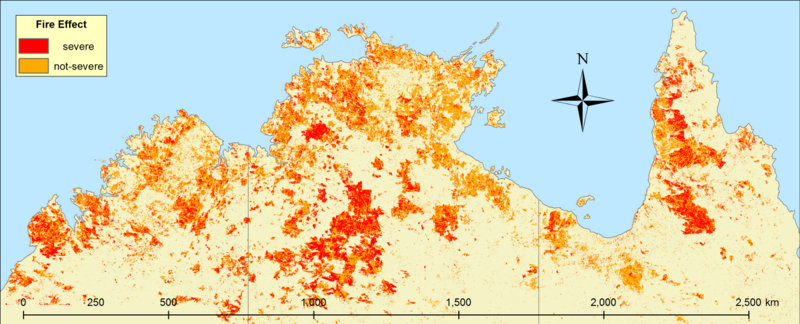
Andrew and his colleagues use nation-wide pre-processed satellite imagery derived products from TERN that show the areas burnt by fires, together with field data, to create fire severity maps of Australia’s Top End.

The team’s method—and indeed the TERN data they rely on—have proved so reliable that the resultant fire severity maps now form an integral part of the Northern Australia and Rangelands Fire Information (NAFI), which monitors and maps the extent and timing of fires across Western Australia, the Northern Territory and Queensland.

In fact, such is the accuracy of the new maps, they are also being used to further develop methods to update and improve the savanna component of the Australian Government’s Emissions Reduction Fund and improve the national carbon budget.

A 2014 fire severity map of northern Australia created by Andrew using TERN's remotely sensed burnt area data product together with field data
Improving Australia’s greenhouse gas accounting

During the dry season, from May to October, savanna fires occur frequently and can extend hundreds of kilometres, representing a major global source of greenhouse gas emissions.

The new fire severity mapping, which provides significantly more detailed information about fires by describing their effect on vegetation, is crucial for accurately determining these carbon emissions.

For example, it allows researchers and fire managers to tell if a fire affected understorey vegetation or the tree canopy. This higher level of detail is important for determining the carbon emissions from savanna burning, as more intense fires burn more of the biomass and result in greater emissions.

“A refined methodology that includes fire severity and seasonality means that the carbon emissions resulting from fires can be calculated with a higher degree of confidence than previously possible,” says Andrew.

Non-severe fires affect only the understorey (a), while severe fires also affect the tree canopy (b). TERN's fire severity mapping provides this information over large areas of northern Australia which is then used to assess ecosystem impacts and carbon emissions.
Mapping burnt area and fire severity

The fire severity product, which was developed in collaboration with the Bushfire and Natural Hazards CRC and other researchers including Dr Stefan Maier, uses the nation-wide TERN AusCover MODIS Burnt Area product to determine the level of change in savanna burnt areas immediately before and after fire.

This remotely sensed information is then calibrated and validated using data collected in the field to ensure the model’s accuracy.

“The data collected by the satellite sensors is sometimes interfered with by atmospheric effects, such as smoke, so we do ground based post-fire vegetation sampling and also take measurements from a helicopter using handheld device with a sensor similar to the sensor that acquires the TERN satellite data to cross-check the satellite information,” explains Andrew.

Fire data for the nation

Currently, severity maps only cover northern Australia, but Andrew says that there is the possibility of extending the product into Australia’s rangeland ecosystems.

“The TERN delivered burnt area product we use to create fire severity maps is Australia-wide so there is definitely scope for expansion into other regions, such as rangelands.”

Such an expansion would mean that fire severity mapping would be available for land managers across more than 75% of Australia. In addition to rangelands, TERN is optimistic that other researchers will grasp this opportunity and utilise this nation-wide resource to produce nation-wide fire severity maps.

TERN’s AusCover MODIS Burnt Area product and the TERN AusCover Fire Severity MODIS North Australia coverage product are now openly available via the TERN Data Discovery Portal and the TERN AusCover website.

Andrew, together with colleagues Grant Staben of the Northern Territory Government (front seat) and Stefan Maier of Maitec (back seat obscured) take measurements from a helicopter using a handheld spectrometer that are used to validate the TERN satellite data (images courtesy of Darwin Centre for Bushfire Research)

Are you using TERN’s research resources or research data repository?  If so, we’d love to hear from you.

Contact TERN eNewsletter’s editor Mark Grant here.

Share Article