A brand-new online flood visualisation tool is changing the way the public and researchers alike look at floods
I think it’s safe to say that we all enjoy looking at historical photos – especially when those photos are of places we know well. We love to look at what our neighbourhoods used to be like and see how places have changed over time.
Many things can change our landscapes and in south-east Queensland one of the most significant modifiers is floods. A new tool is using historical photos together with maps, data and videos to visualise the effects floods have our landscape and communities.
The new tool, developed by TERN’s Australian Coastal Ecosystems Facility (ACEF) and jointly sponsored by TERN, CSIRO and Australian National Data Service (ANDS), uses infrastructure delivered through the ANDS-funded SEQuITOR program to explore and visualise the effects of floods across the Logan and Albert catchments and into Moreton Bay. It tells the story of recent and historical flooding in the Logan River catchment using maps, data, videos and photos.
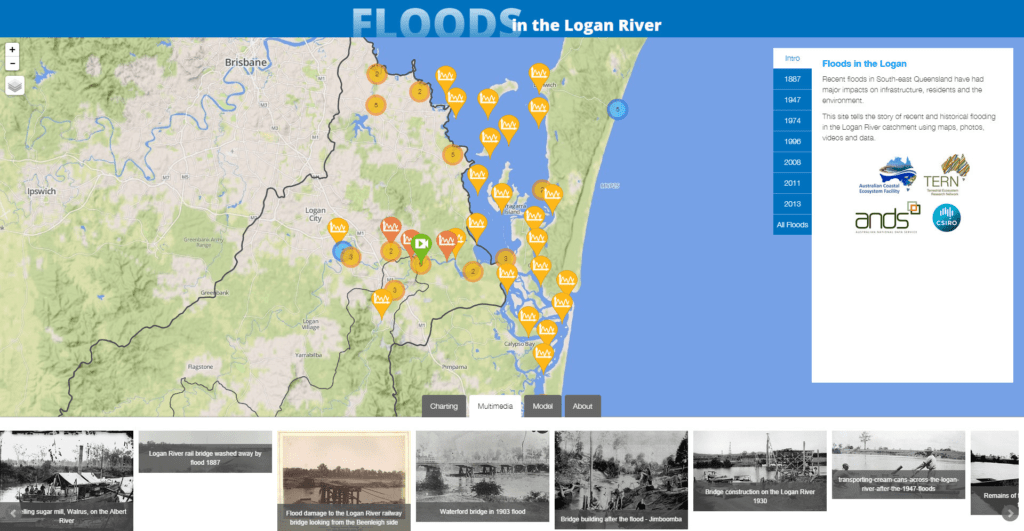
A screenshot from the flood visualisation tool prototype that tells the story of recent and historical flooding in the Logan River catchment using maps, data, videos and photos
The tool has collected photos of flood events in the Logan area from a whole raft of sources from the past 120 years and is providing them in one openly-accessible central location. Jonathan Hodge of ACEF has been collating these photographic records and believes they’re a vital component of understanding and managing the effects of floods.
‘Combining photos and videos with complex scientific data helps to ground our science and data in reality,’ says Jonathan. ‘They help show the impact of events shown in the data and communicate what a simple graph or number such as a flood height might have actually meant during these historical events. This helps to create a community memory, which can lead to improved community resilience.’
Donald ‘DJ’ Mackenzie of Logan City Council is equally excited by the use of photos and the tool’s potential.
‘What’s great about the visualisation tool is that it provides a space for the community to learn about flooding events and the implications on catchment dynamics and river health,’ says DJ. ‘Users are told an amazing story of the history of floods in Logan and are able to connect with images of local landmarks and learn how they have been affected and changed.’
The flood visualisation tool is currently in production and will be released by the end of the year. In the meantime, take a look at just some of the historical photos of the Logan River that will be available alongside technical flood data when the tool is released.
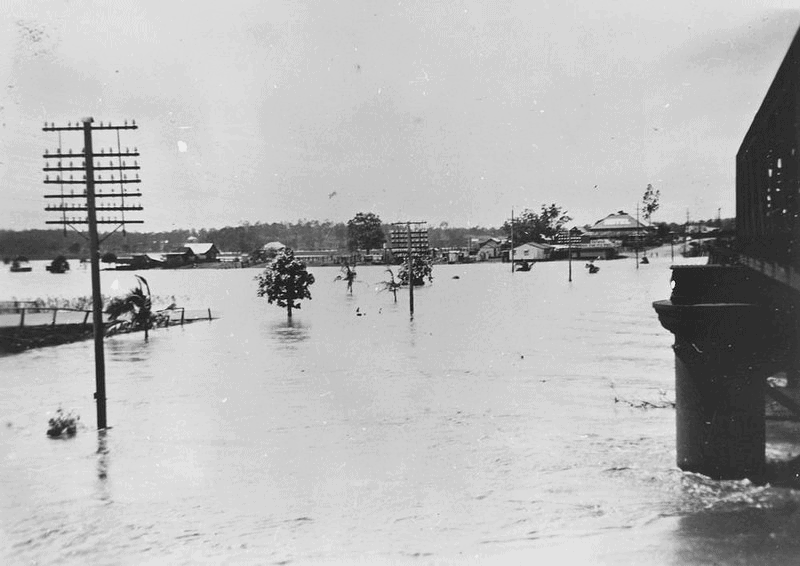
Floods at Yatala in 1947 (http://hdl.handle.net/10462/deriv/146445)
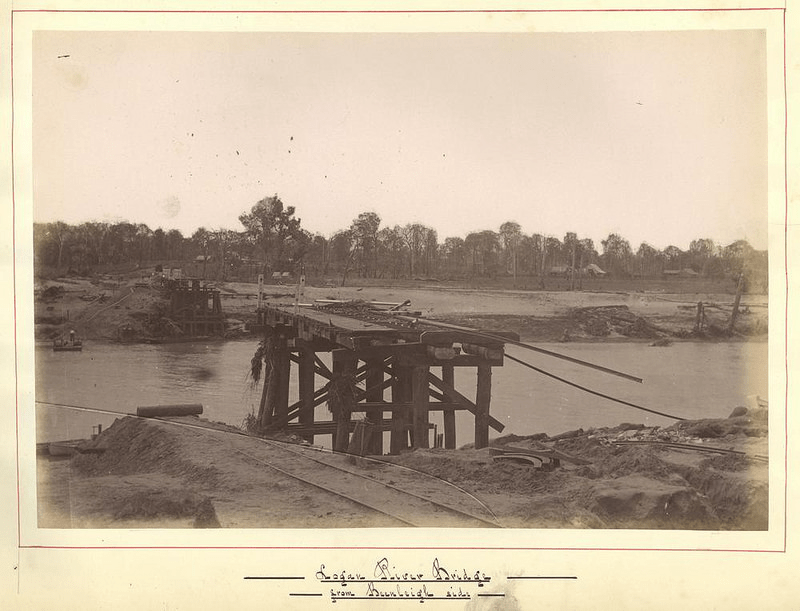
Flood damage to the Logan River railway bridge looking from the Beenleigh side (http://hdl.handle.net/10462/deriv/39944)
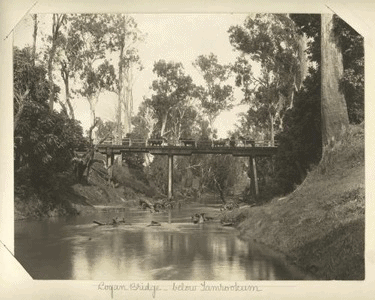
Riders on the Logan Bridge below Tamrookum, 1903 (http://hdl.handle.net/10462/comp/503)
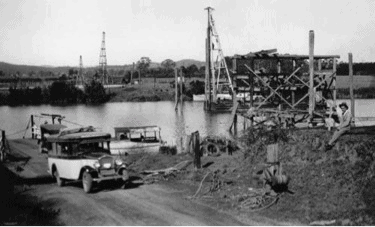
Bridge construction on the Logan River, 1930 (http://hdl.handle.net/10462/deriv/12980)
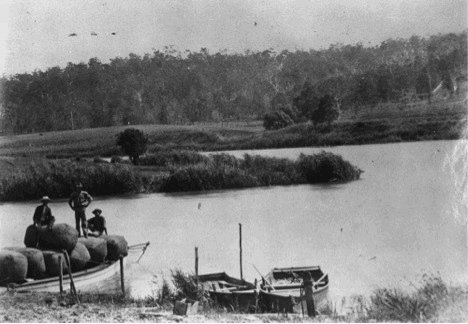
Farm labourers returning with baled hay, Bethania, Queensland. The body of water in the foreground no longer exists because it was filled with silt during the 1974 flood. (http://hdl.handle.net/10462/deriv/144386).
Photographs: John Oxley Library, State Library of Queensland
Published in TERN’s Environmental Monitoring newsletter October 2014