Mode values of seasonal peak Enhanced Vegetation Index (EVI) calculated using an algorithm designed to accommodate Australian conditions. The product can be used to characterize phenological cycles of greening and browning and quantify the cycles’ inter and intra annual variability from 2000 to 2012 across Australia.
Satellite and aerial mapping is becoming so sophisticated that, with additional development by researchers and commercial mappers, it is already starting to help farmers make decisions about fertilising or harvesting crops, moving livestock, and other typical economic and land-management decisions.
The idea is not as futuristic as it might first seem. Ecosystem data from TERN’s AusCover facility captured from instruments aboard satellites or aircraft is being used in a variety of ways, and that includes the means to assist in sustainable land management.
At the broad continental or regional scales, the data can help monitor seasonal changes in vegetation cover, land degradation, and habitat fragmentation in natural and managed ecosystems, in response to large scale climatic and other factors that affect crop productivity and ecosystem services. And at higher levels of detail, remote-sensing imagery derived from either high-resolution satellites or aircraft-mounted systems is able to provide much more detail, and in three dimensions, on the structure, physiology and precise location of different crops and forest plantations, and adjoining patches of native vegetation.
A couple of examples show the scope of the technology to help people make better land-use decisions – and help protect the environment around them. At the broad scale, AusCover researchers have recently developed a new vegetation dynamics monitoring and modelling product to suit Australian conditions – filling an important information gap that global products failed to cover.
The product uses high-temporal resolution satellite technology (courtesy of NASA’s Terra and Aqua satellites) to quantify vegetation life cycle dynamics (phenology) and analyse how these are influenced by seasonal and inter-annual variations in climate. The Australian Phenology Product, is providing end-users a characterisation of how different parts of Australia’s land-cover is growing and developing with the change of seasons which is vital information for anyone also in the agricultural and horticultural industries.
Being able to characterise phenology in unprecedented detail can inform agricultural management decisions and the timing of tasks such as planting, fertilising, watering, and harvesting. The product’s modelling component will help to predict future changes in Australia’s phenology including growing areas, seasons and growing cycles.
At the higher resolution, a farmer with an intensive fruit plantation can use remotely sensed images to identify variations in crop performance that could be attributed to water or nutrient deficiency, or the presence of pests or diseases. Knowing this, and being able to see the precise extent and variation of it allows the producer to apply remedies in a more targeted manner. This means they can localise their remedy, which helps them maximise their efficiency. It leads to better harvests, for example because all plants in the crop mature together. At the same time, they reduce wastage and lessen the impact on surrounding landscapes.
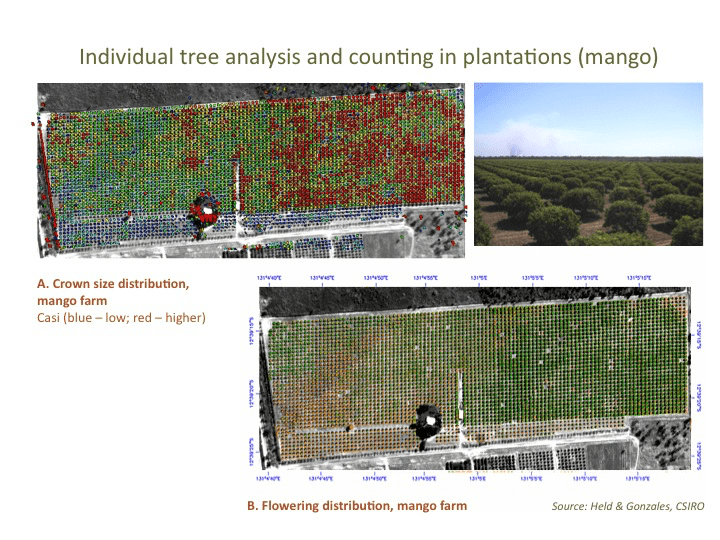
Satellite and aerial images can reveal valuable information for farmers. Part A depicts the relative differences in the size of tree crowns across a single paddock in a mango plantation near Darwin. They range from red, representing large crowns, to blue, representing small crowns. Part B depicts the extent of flowering on the same mango farm. Orange shows where a lot of the mangoes are flowering, and green where there few or none are.
Published in TERN newsletter November 2014