
Symposium Abstracts
The Symposium program and a list of abstracts are available to download below.
Download the draft Abstracts (v3 5 July)
Download the draft Symposium Program (v1 24 June)
Session One: Climate Impact on Ecosystems
Landscape level assessment of tree drought mortality in forest ecosystems of the Strathbogie Ranges in Australia
Prof Stefan K Arndt, Wagner B, Baker P, Nitschke C Prof Stefan K Arndt
Using Landsat images from one year before and shortly after the drought event we calculated the plot difference Normalized Burn Ratio (dNBR) for the entire Strathbogie Ranges. This index is used to detect bushfire impact in forests, but was able to detect the drought canopy collapse accurately. However, while the method was slightly too sensitive, it accurately predicted all areas with a high degree of drought canopy collapse. Overall the drought canopy collapse was not widespread and was detected in six local areas. Gridded climate analysis revealed that rainfall or temperature in summer and autumn of 2019 was unlikely to have caused the canopy collapse on its own. Shallow soils and occurrence of rocky outcrops reduced soil water availability to trees in the impacted areas. Plot-based inventories confirmed that tree canopy collapse occurred in all five eucalypt species that are common in the region and there was no difference in the drought vulnerability among species.
The role of rainfall amount and intensity in driving tree growth across semi-arid and tropical Australia
Dr Alison O’Donnell
Understanding how tree growth responds to changes in the amount, frequency and intensity of rain events is critical to predicting how climate change will impact on forests and woodlands in the future. We used five tree-ring records of the native Australian conifer Callitris columellaris that span a large climatic gradient from the tropical north to the semi-arid south of Australia to investigate how inter-annual and spatial variation in the delivery of rainfall (the amount, intensity and frequency of rain events) influences tree growth. We found that tree growth is strongly and linearly related to rainfall amount in semi-arid biomes and most strongly related to the amount of rain from heavy (>75th percentile) rain events or the number of extreme (>90th percentile) rain days. In contrast, growth in the tropics is non-linearly related to rainfall amount; growth is less responsive to changes in rainfall amount at the higher end of the rainfall range than at the lower end. Our findings indicate that predicted future declines in rainfall are likely to have proportional negative impacts on tree growth in semi-arid biomes, while in the tropics, projected increases in the inter-annual variability of rainfall are likely to have greater impacts on long-term growth rates than changes in the mean amount of rainfall. Our findings also indicate that projected increases in the intensity of extreme rain events are likely to have contrasting impacts on tree growth in different biomes, with greater and positive impacts on growth in semi-arid biomes and potentially negative impacts on growth in tropical biomes of Australia. Our results highlight how contrasting growth responses of a widespread species across a hydroclimatic gradient can inform understanding of potential sensitivity of different biomes to climatic variability and change.
Stress, recovery and resilience to climate extremes in Australian ecosystems and agricultural landscapes
Dr Jamie Cleverly
Australia experiences its fair share of droughts and flooding rains, heatwaves and bushfires. Our natural ecosystems are largely resilient to climate extremes, in which those ecosystems that show the capacity to survive stress often demonstrate an extraordinary capacity to recover with vigour to the return of favourable conditions. Bringing this understanding of ecosystem resilience to climate extremes is of great value going forward for agricultural ecosystems, where institutional knowledge over generations of farming has brought close coupling between crop productivity and water use. This presentation will explore some of the key factors that will enable the prediction and forecasting of ecological responses to climate variability, both in Australia and abroad.
Tapping into the physiological responses to mistletoe infection during heat and drought stress
Dr Anne Griebel
Mistletoes are emerging as important co-contributors to tree mortality across terrestrial ecosystems, particularly when infected trees are stressed by water limitations during drought. In Australia, mistletoe distributions are expanding in temperate woodlands, while their hosts experienced unprecedented heat and drought stress in recent years. To investigate whether the excessive water use of mistletoes increased the probability of xylem embolisms, we monitored transpiration of infected and uninfected branches from two eucalypt species over two summers at the Cumberland Plain Supersite and used hydraulic vulnerability curves to estimate percent loss in conductivity for each species. We further coupled intensive observations of mistletoe population dynamics with measurements of host tree stem growth, canopy turnover and stand structure to monitor how mistletoe infection alters above-ground biomass distribution during and after a three-year drought. We show that daily transpiration increased up to five-fold for infected branches, resulting in an increase of up to 11% loss in conductivity. Moreover, severe mistletoe infection reduced live standing biomass and canopy volume, and a mistletoe-to-host leaf area ratio above 60% significantly reduced basal area growth. Yet, concurrent increases in basal area and the TERN SCIENCE SYMPOSIUM 5 thickening of canopy volume indicate that host trees recover rapidly, after the threeyear drought combined with record summer heat nearly extinguished the mistletoe population. The potential devastating effect of mistletoe infection on host survival has distracted from the challenges that mistletoe populations are facing when increasing drought and heat stress threaten their survival in healthy populations.
The water-use efficiency response of eucalypts to rainfall is modulated by soil phosphorus across Australia
Ass Prof Lucas Cernusak
Ecological theory predicts that along a resource availability gradient, genotypes and species that use that resource more efficiently should be selected for as its availability decreases. Strong rainfall gradients from near the coast to the arid interior of Australia provide an opportunity to test this prediction with respect to plant wateruse efficiency, the rate of photosynthesis for a given amount of water loss to the atmosphere. A number of such transect studies have been performed, examining leaf stable carbon-isotope ratios as a proxy for time-integrated, intrinsic water-use efficiency. Interestingly, different transects in Australia have shown widely varying responses of carbon-isotope ratio to rainfall, with relatively strong responses observed in south-eastern Australia, and much more muted responses observed in northern Australia and south-western Australia. We considered two hypotheses that might provide insight into these observed geographic differences: rainfall seasonality – if rainfall is highly concentrated seasonally, such as in northern and south-western Australia, expected responses to annual rainfall might be damped; and soil phosphorus concentration – very low soil phosphorus in Australian soils of some regions might favour high transpiration as a mechanism to accumulate phosphorus at root surfaces, thereby lessening the carbon-isotope ratio response to decreasing rainfall. To test which explanation is more likely, we sampled leaf carbon isotope ratios along a rainfall gradient in north-eastern Australia, which has high rainfall seasonality combined with relatively high soil phosphorus, a combination not found in the previously sampled transects. We found a strong response of leaf carbon-isotope ratio to decreasing rainfall, comparable to the south-eastern transects. Of the two considered hypotheses, our results indicate that soil phosphorus modulates the water-use efficiency response of eucalypts to rainfall among regions of Australia, not whether the distribution of rainfall within the year is highly seasonal.
Developing best practice Himawari data products for enhanced sub-daily monitoring and climate impact studies of Australia’s ecosystems
Prof Alfredo Huete
From July 2015 onwards the Advanced Himawari Imager (AHI), located on the Japanese Meteorological Agency’s suite of operational geostationary satellites, acquires data every 10 minutes for the entire Asia-Pacific hemisphere data in 16 bands (from the visible, near infrared and thermal infrared with spatial resolutions from 0.5 km to 2 km depending on the band). AHI provides unparalleled high-temporal imagery for Australian researchers to better understand how our ecosystems function by tracking important sub-daily and daily processes over multiple years. Tracking land-surface processes requires that cloud masking, atmospheric correction and sun-target observer angular dependency correction have all been implemented to produce accurate Level 1 AHI products of: (a) reflectance; (b) albedo; (c) surface solar irradiance (total partitioned into the direct and diffuse components); and (d) land surface temperature. These Level 1 products are then linked with biophysical models / analytical frameworks to monitor Level 2 sub-daily / daily processes including: (i) phenological processes; (ii) actual evapotranspiration (AET) and sensible heat fluxes; (iii) ecosystem stress / ecosystem resilience; (iv) Gross Primary Productivity (GPP); (v) resource use efficiencies, both Light Use Efficiency (LUE) and Water Use Efficiency (WUE); and (vi) photosynthetic capacity (Pc). Enhancing our biophysical understanding of these processes means we are better placed to predict how ecosystems will respond to simultaneous stressors such as climate change (warming, drying, extreme events) and other disturbance regimes. These processes govern Australia’s ecosystems and heavily influence the biodiversity and other ecosystem services (e.g., water, food, carbon) they provide. Our TERN Landscapes project recently commenced and this presentation outlines progress in developing Level 1 products and plans to derive advanced Level 2 ecosystem understanding.
Demonstrating post-fire changes in vegetation and soil using TERN Surveillance monitoring: a case study from the Kangaroo Island bushfires
Tamara Potter
Bushfires have been a feature of the Australian landscape for millions of years and play a vital role in influencing the dynamics of ecological communities. Fires can alter both the abiotic properties of an ecosystem, such as the physical aspects of soil, microclimate and hydrology, as well as the biotic components, like vegetation structure and species composition. With fire intensity and frequency increasing in recent decades, the importance of monitoring and detecting fire-related changes within soil and vegetation communities is becoming more imperative. In the past, monitoring the impacts of fire has been challenging, often ad-hoc, small-scale, and specific. TERN’s Ecosystem Surveillance platform has been implementing nationwide soil and vegetation data collection and sampling over the past 10 years, following standardised survey methods. Using Kangaroo Island and the 2019/2020 summer bushfires TERN SCIENCE SYMPOSIUM 7 as a case study, we demonstrate the benefit of these methods in identifying and monitoring change in vegetation structure and composition, and soil characteristics in response to fire.
Assessment of flux tower energy and water balance variables over Australian climate zones: implications for modelling
Thomas Van Niel
Climate determines the general spatial patterns and timing of the dynamics of energy and water fluxes. The TERN flux tower network has expanded to the point where it now covers the major climate zones of Australia, with some Supersites collecting data for decades. This allows for an opportunity to better understand the influence of Australia’s climate on the interactions between energy and water balance variables. We performed an assessment of the interaction between flux tower observed energy balance components of available energy, latent heat flux, and sensible heat flux with precipitation and soil moisture dynamics of the top 10 cm of the soil profile for the major Köppen-Geiger climate zones across Australia (tropical, arid, and temperate). Results were placed in the context of popular evaporation modelling theory. This study found that climate determined the primary driver of water and energy flux and highly impacted even the very basic interpretation of the interaction between evaporation and soil water dynamics. A potential framework for identifying this interaction is introduced and implications for modelling evaporation from remote sensing are put forward.
Session Two: Ecosystem Biodiversity
Biodiversity and biogeography of wood decay fungi within the TERN Australian Field Observatory SuperSites
Dr Jeff Powell
Fungi are key agents of wood decomposition, returning carbon to the atmosphere. While biotic interactions such as competition among fungi are suggested to impact wood decay, these biotic interactions are rarely documented in the field. In addition, the effects of decomposer fauna on fungi are rarely considered even though their activities are likely to reduce colonisation limitations (by placing wood in contact with soil microbes) and modify chemical characteristics that influence microbial succession. Here, we identified fungi colonising blocks of Pinus radiata placed on the soil surface at thirteen TERN SuperSites and exposed (or not) to termites and other macro-invertebrates. Blocks were collected again after 12 to 24 months, with multiple harvests at some sites, and fungal communities characterised using high-throughput DNA sequencing. Hierarchical modelling was used to identify environmental variables and decay attributes associated with selection and residual biotic interactions among fungi. Decomposition, termite-associated damage and temperature were the most important variables identified. Fungal composition was also linked to the degree that baits exhibited damage caused by fungi. Exposure time, precipitation, aridity, forest cover and elevation were only weakly linked to fungal composition. Increased termite damage was more frequently associated with a reduced frequency of fungal species, although exceptions were observed. After accounting for these variables, we found evidence for relatively few negative co-occurrences among fungal species (4% of pairs). Positive co-occurrences were more frequently observed (10% of pairs). These results highlight the roles that climate and biotic interactions play during community assembly for wood decay fungi. The frequencies of positive and negative cooccurrences suggest a greater importance for facilitation compared to competition in this system, which we have also observed in other systems. The relatively high frequency of negative interactions between termite activity and fungi is surprising and suggests research is needed to understand this process.
Celebrating 10 Years of TERN Ecosystem Surveillance across Australia
Emrys Leitch
In the last 10 years, TERN has set up more than 800 soil and vegetation monitoring plots across Australia. These plots now span all of the major terrestrial biomes across the country. The success of the program has enabled a wide range of research and TERN SCIENCE SYMPOSIUM 9 land management projects and collaborations across numerous disciplines. The logistics of running such a program across an entire continent has also presented challenges. In this presentation we will highlight our successes, discuss some of the challenges faced in the rollout, and look ahead to an exciting future for the TERN Ecosystem Surveillance monitoring network.
Applying conservation reserve design strategies to define ecosystem monitoring priorities
Dr Irene Martin-Fores
In an era of unprecedented ecological upheaval, accurately monitoring ecosystem change at large spatial scales and over long-time frames is an essential to effective environmental management and conservation. However, economic limitations often preclude revisiting entire monitoring networks at a high enough frequency to accurately detect ecological changes. Thus, a prioritisation strategy is needed to select a subset of sites that meets the principles of complementarity and representativeness of the whole ecological reality. We applied two well-known approaches for conservation design, the ‘minimum set’ and the ‘maximal coverage’ problems, to develop a strategic monitoring prioritisation procedure that compares potential monitoring sites using a suite of alpha and beta biodiversity metrics. To accomplish this, we created an R function that performs biodiversity metric comparisons and site prioritisation on a plot-by-plot basis. We tested our procedures using data from 774 vegetation plots provided by TERN AusPlots. We selected 250 plots and 80% of the total species recorded for the maximal coverage and minimum set problems, respectively. We compared the results of each approach in terms of ecological complementarity (species accumulation) and the spatial and environmental representativeness of the plots selected by the different biodiversity metrics. We repeated the selection process for clusters of plots to incorporate logistic constraints for field expeditions. We found that prioritisation based on species turnover (i.e. most dissimilar plots in terms of species composition but ignoring species richness) maximised ecological complementarity and spatial representativeness, while providing high environmental coverage. Species richness was an unreliable metric for spatial representation, whereas corrected weighted endemism failed to capture ecological and environmental variation. Range-rarity-richness was a more balanced metric in terms of complementarity and representativeness.
Our results inform monitoring design and conservation priorities, which should consider changes in the turnover component of the beta diversity instead of being based on univariate metrics.
Advances in drone remote sensing for ecosystem monitoring
Prof Arko Lucieer
Knowledge of vegetation structure and condition are critical to evaluate ecosystem health and quantify the resilience of ecosystems to the pressures of climate change and extreme events. To provide a synoptic assessment of natural ecosystems at landscape scale, drone-based remote sensing provides a unique opportunity to collect ultrahigh-resolution imagery advancing our ability to map vegetation composition and structure. This TERN sub-project aims to advance drone data collection and processing techniques. We are developing new protocols for data collection and processing of raw sensor data to produce analysis-ready data products, such as RGB and multispectral orthomosaics and 3D point clouds. In doing so, this project will advance our ability to monitor environmental resilience of natural ecosystems. In this presentation, we will give an update on the current drone technology, sensors, and accurate positioning. In addition, we will provide an overview of the use of drone remote sensing for assessment of biodiversity.
Investigating fire responses in endangered ecological communities of the Cumberland Plain in northwest Sydney
Dr Alison Hewitt
Over 200 years of extensive land clearance on the Cumberland Plain of Western Sydney has resulted in highly fragmented ecosystems that are now under added threat from accelerating climate change and altered fire regimes. This project is assessing impacts and monitoring recovery from fire in two threatened ecological communities of the Cumberland Plain: Castlereagh Scribbly Gum Woodland and Cooks River/Castlereagh Ironbark Forest. Detailed fire histories of the area have been compiled and vegetation structure and floristic composition are being quantified in fragments with differing times since fire using a combination of remote sensing (airborne LiDAR) and on-ground biodiversity surveys. We hypothesise that relationships between biodiversity (e.g., species richness, tree hollows) and ecosystem structure (e.g., canopy height and heterogeneity) will emerge in response to fire and other disturbances. This project will inform management of these endangered ecological communities by evaluating the risk of invasive species encroachment and short and long term vegetation dynamics and recovery following fire. The project is being led by Western Sydney University in partnership with stakeholders Deerubbin Local Aboriginal Land Council, Greater Sydney Local Land Services, University of NSW, Department of Planning, Industry and Environment, Cumberland Land Conservancy and the NSW National Parks and Wildlife Service. All raw LiDAR and plot level data will be archived and made accessible via the Cumberland Plain Terrestrial Ecosystem Research Network (TERN) data portal, which is managed by Western Sydney University personnel (Pendall and Boer).
Extending biodiversity monitoring across space and time through citizen science
Dr Katie Irvine, Sally O’Neill, Rosalie Lawrence, Robert Lawrence, Tom Saleeba, Andrew
Tokmakoff, Greg Guerin, Ben Sparrow
Over the past three years we created and implemented a TERN-allied national citizen science project called Wild Orchid Watch (WOW). We learned valuable lessons through this process, from achieving greater temporal and spatial coverage in biodiversity monitoring to best practice when inviting community members to participate in project design and data collection. Citizen science projects which are planned and implemented with community involvement and training can meet the needs of both the community participants and researchers. We found that citizen science biodiversity monitoring can provide more than just species identification, date and location; users input a range of ecological monitoring data for far reaching research and conservation outcomes. Appropriate use of technology is key. Apps have changed the game for community-scientist collaboration, but the complexity of designing custom technology and the potential pitfalls associated with setting up a citizen science project should not be underestimated. Nevertheless, well-designed and resourced citizen science projects can provide a range of beneficial outcomes for community members and scientists. We are now applying the knowledge and experience gained through the process of creating WOW to a new TERN pilot citizen science project. We look forward to sharing the details and initial results.
Session Three: Good Data and Models for Good Science and Management
Australian land surface phenology product from MODIS and VIIRS satellite data
Dr Qiaoyun Xie
Qiaoyun Xie1,*, Caitlin Moore2,3, Jamie Cleverly1, Alfredo Huete1
1. Faculty of Science, University of Technology Sydney, Ultimo, NSW 2007, Australia
2. School of Agriculture and Environment, The University of Western Australia, Crawley, WA, 6010, Australia
3. Institute for Sustainability, Energy and Environment, University of Illinois Urbana-Champaign, Urbana, IL,
61801, USA
* Correspondence: Qiaoyun.Xie@uts.edu.au
Land surface phenology (LSP), the study of seasonal dynamics of vegetated land surfaces from remote sensing imagery, reflects response of ecosystems to climate change. Phenological shifts have substantial impacts on ecosystem function, biodiversity, and carbon budgets at multiple scales. The global Moderate Resolution Imaging Spectroradiometer (MODIS) Land Cover Dynamics Product MCD12Q2 was developed to characterize the LSP of global ecosystems, but it failed to provide well-defined spatial pattern of LSP for arid and semi-arid areas in Australia, which may be related to climatic variability causing high LSP variability. In contribution to AusCover/Terrestrial Ecosystem Research Network (TERN), we developed the Australian LSP Product to suit highly variable Australian conditions. This study introduces two sets of national maps of phenological metrics, produced using MODIS Enhanced Vegetation Index (EVI) data from 2002 to 2019, and Visible Infrared Imaging Radiometer Suite (VIIRS) EVI data from 2012 to 2019, respectively. The product provides eight phenological metrics at 500 m resolution of up to two seasons each year, including the first and second minimum point, start, peak, end, length, and amplitude of the season. Integrated EVI under the curve between the start and end of the season time was calculated as a proxy of productivity. We evaluated our product by comparing it with the MCD12Q2 product, and against the phenological metrics extracted from eddy covariance gross primary production data. From quantifying ecosystem resilience to climate change, bushfire fuel accumulation, to informing agricultural management decisions and crop yields, the product’s list of real-world applications is enormous.
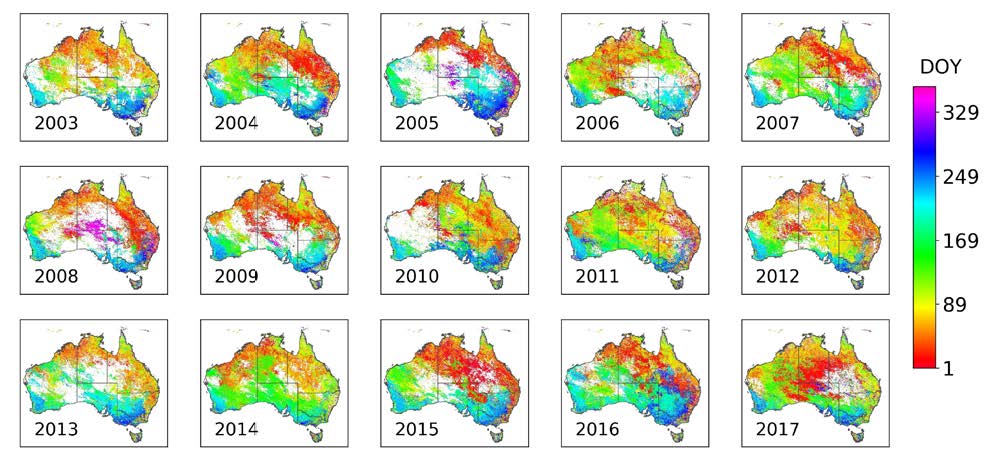
Figure. Peak of the growing season for the first growing season captured by our product from 2003 to 2017. DOY represents day of year, with DOY equals 1 being 1st January.
Developing a multi-decade, operational, Australia-wide, monthly, 30m actual evapotranspiration dataset: Part 1 Calibration of multiple Earth observation sensors
Dr Juan Guerschman
Actual evapotranspiration (ETa) is the phase change of liquid water to its gaseous state, linking the energy- carbon- and water-balances. It is an essential dataset for environmental monitoring to, as examples, assess: (i) the catchment/landscape water balance; (ii) water use efficiency; (iii) irrigation compliance; and (iv) the water regimes of ground-water dependent ecosystems and other biodiversity hotspots. In a TERN Landscapes project we calibrated the CMRSET (CSIRO MODIS Reflectance based Scaling EvapoTranspiration) model across the continent using five remotely sensed data products with temporal frequencies ranging from daily (MODIS, VIIRS) to multi-days (Landsat and Sentinel-2) and spatial resolutions from 500 meters (MODIS, VIIRS), 30 meters (Landsat) to 20 meters (Sentinel-2). CMRSET was calibrated using daily latent heat observations from the 29 TERN OzFlux sites, representing a wide variety of land covers and climates. The calibrated CMRSET model was able to estimate daily ETa observed at the OzFlux towers with a Relative Root Mean Squared Error (rRMSE) / coefficient of determination (R2) ranging between 0.16 / 0.96 (Sentinel-2) to 0.27 / 0.92 (VIIRS). Additionally, to check its utility for catchment water balance modelling, we compared the performance of CMRSET to long-term (5 years or more) differences between mean annual precipitation and ETa with measured streamflow at 638 unimpaired catchments across Australia. This comparison yielded a RMSE of 0.47 mm/d (rRMSE of 0.24) and a R² of 0.76, demonstrating that the data are suitable for catchment water balance studies. With MODIS soon ceasing operation (2022), calibrating CMRSET with VIIRS, Landsat and Sentinel-2 (all operational, not research, Earth observation platforms) means that ETa can be routinely calculated for all-Australia from 2000 to 2040.
Developing a multi-decade, operational, Australia-wide, monthly, 30m actual evapotranspiration dataset
Jamie Vleeshouwer
Actual evapotranspiration (ETa), the phase change of liquid water to a gas, is needed across Australia at high spatial resolution (e.g., 30m) and high temporal frequency (e.g., monthly) for environmental monitoring. Key uses of such gridded ETa data include: (i) monitoring the catchment/landscape water balance; (ii) tracking water use efficiency; (iii) monitoring irrigation compliance; and (iv) understanding the water regimes of ground-water dependent ecosystems and other biodiversity hotspots. We used the calibrated CMRSET (CSIRO MODIS Reflectance based Scaling EvapoTranspiration) coefficients produced in a TERN Landscapes project with time-series Landsat and VIIRS satellite Earth observation data within Google Earth Engine to track ETa across Australia from 2000 onwards. Landsat has high resolution (30 m) yet low frequency (16-days) contrasting VIIRS having low resolution (375 m) and high frequency (daily). Synchronous cloud cover over parts of the Australian continent with Landsat observations means there are places / times when no Landsat observations are available for a month. To infill such Landsat-cloud gaps we use VIIRS-Landsat blending, augmented by linear interpolation as required, to generate a continuous (gap-free) ETa gridded dataset at high spatial resolution (e.g., 30 m) and high temporal frequency (e.g., monthly). This dataset qualifies for the ‘big data’ tag being 42 Tb from 2000 to current, growing by 4 Tb each year. As such making these data available to a range of users, some of whom want access to the monthly series of gridded data for specific locations to those who prefer summaries for either areas of interest that are user-defined (e.g., clicking on a map) or pre-defined (e.g., an IBRA region, National Park, or surface water catchment) raises a series of challenges.
Building a near real time continental soil moisture prediction using a Data-Model Fusion Approach system for Australia
Matthew Stenson
Soil moisture is a critical driver in ecological function and landscape condition through water availability to plants within unsaturated zone. Additionally, it is a key component in controlling how quickly runoff may occur in a particular landscape due to rainfall and is an important variable in managed landscapes for the initiation of planting, irrigation and application of fertilisers such as nitrates. Traditionally soil moisture is measured using point-based sensors either via electrical resistance or neutron absorption, and while these data are useful at a paddock scale, the ability to interpolate to larger areas is limited. Typically, in order to estimate soil moisture over large areas, for example continental scales, physically based modelling is required to upscale relevant point scale measurements, but modelling is often unable to adequately capture and represent all of the physical processes involved due to inadequate parameterisation and low quality forcing data. Recently satellite products that estimate soil moisture at a global scale have become available and while these products have a continental coverage, and often a daily timestep, their spatial resolution is too coarse for appropriately scaled management decisions, and importantly they fail to capture important local processes. The SMIPS soil moisture system developed through TERN, takes a data model fusion path to produce daily estimates of volumetric soil moisture by combining the local physical representation of modelling with the spatial coverage in terms of national digital soil information and the temporal consistency of satellite based products, to produce a “best-of-both-worlds” continental scale soil moisture product.
Detecting and correcting data errors in time series observations from geographically remote monitoring stations
Ashley Sommer
Across Australia there are thousands of environmental monitoring stations continually collecting observations for the use in research, academic, and commercial applications. The remoteness of these stations makes it difficult for the collected data to make their way into the hands of those who need to use it. Various methods are employed to send the data from the remote stations to the end user, the most common being commercial communications satellite providers. The data are usually received into a destination database, and directly used for applications such as trend analysis, fitting scientific models, training machine learning algorithms, and making agronomic decisions. How confident can we be that the received data are error-free? Data errors can and do occur, and fall into 3 broad categories; invalid observations, missing records, and duplicated records. Invalid observations can take the form of corrupted data, out-of-range values, and unpopulated fields. These are generally easy to detect using simple heuristics at the time of receipt and either flagged or discarded. However missing or duplicated observations present a greater problem. Missing records take the form of timesteps skipped by the station’s datalogger, records observed by the station but not sent, and records sent but not received, and present as gaps in the timeseries. Duplicated data can be caused by records sent more than once from the station and/or records processed more than once in the database. When duplicated records have slightly different timestamps, it becomes difficult to detect. When missing or duplicated records exist, this lowers the quality of the dataset and adversely affects the data applications, particularly on accumulated values such as rainfall that aggregate their values over time. This presentation looks at various methods we’re implementing in TERN Landscapes to detect and correct invalid, missing, and duplicated records in the TERN supported COSMOZ Soil Moisture Network.
Towards harmonisation and integration of ecology data
Dr Siddeswara Guru, Edmond Chuc, Javier Sanchez Gonzalez, Habacuc Flores,
Tina Parkhurst, Jenny Mahuika, Anusuriya Devaraju
There is a significant amount of data collected in ecology to monitor the environment by measuring biodiversity and ecological process at a certain point in time and space. Plot-based monitoring is used to survey vegetation and ecosystem processes that use repeatable methods and procedures. Repeated measurements of the same observed properties would enable us to decide on on-going environmental and resource management practices.
Generally, data collections are project-based, collected for a specific purpose and use the same monitoring methodologies at different plots covering more extensive geographical locations. These datasets are of considerable significance if they are integrated with other similar projects or programs. The handling and integration of ecology data are complex and challenging. Some of the challenges faced during the data integration include uncertainty of source data management and capturing, and harmonising different data terminologies and methodologies.
We will describe the development of Plot-X, the standard to represent and exchange plot-based survey data. The Plot-X provides an information model with an aim to integrate ecological field survey data. The information model represents domain concepts such as ecology plots, plot visits, several domain features associated with plots and observations related to the domain features. We will showcase the system developed to represent and integrate ecology data that will enable users to query data at individual observation level.
ausplotsR – rapid access to vegetation plot data across environments
Dr Greg Guerin
Vegetation and soils data
TERN Ausplots is a plot-based ecosystem surveillance monitoring method and dataset for Australia. Key vegetation and soil parameters and samples have been systematically collected across a national network of plots to enable continental comparisons and tracking of long-term change. The dataset records a series of survey modules, which can be accessed through ausplotsR, including site information; full vouchered vascular plant inventory; ground and vegetation cover from point-intercepts; tree basal area; vegetation structural summary; and soils, including barcodes of physical samples.
Environmental coverage
Plots were originally stratified across the rangelands using cluster analyses to group similar bioregions. The scope was broadened to all terrestrial ecosystems, and subsequent site selection comprised gap-filling and opportunistic sampling. Gap-filling was optimised using iterations of targeted field campaigns and generalised dissimilarity models which predicted the most ecologically different target sites. 99.995% of Australia is now predicted to share some ecological similarity to at least one plot, despite remaining gaps such as the north-west deserts, wet tropics and tall eucalypt forest (sampled by TERN Ausplots Forests).
Accessing data
ausplotsR is a TERN R package that allows users to immediately obtain up-to-date Ausplots data, pre-process the data to facilitate rapid export or analysis, and apply built-in calculations and graphical applications to explore the dataset. ausplotsR has served over ten thousand requests for data to over 440 users, comprising 5,000,000 sites of data and 1.2 billion total records. Since publication on CRAN in November 2020, the package has been downloaded over 3,000 times.
Acknowledgements
We thank TERN (https://www.tern.org.au) supported by the Australian Government through NCRIS. For more information, see https://CRAN.R-project.org/package=ausplotsR, https://github.com/ternaustralia/ausplotsR.
Session Four: Methods
Standardising environmental monitoring protocols and data systems for improved decision-making (1st set of protocols)
Julia Bignall, Mark Laws, Kimberly McCallum, Sally O’Neill and Ben Sparrow
Conservation and restoration programs and environmental impact assessment decision-makers need access to consistent, comparable data across programs, jurisdictions and ecosystem types to understand change and effectively inform natural resource management (NRM) and conservation decision-making. TERN is working with the Department of Agriculture, Water and the Environment (DAWE) to co-design standardised ecological monitoring protocols and a data exchange system. The new protocols build on TERN’s data aggregation systems and well-tested field survey protocols. TERN has produced a set of modular methods implemented at over 700 monitoring plots Australia-wide since 2012. A modular approach to the protocols will efficiently enable individual projects to collect information that is relevant to their project, whilst not requiring the collection of information beyond the scope of their project needs. This project will ensure service providers and ecologists collecting field data have ready access to comprehensive instructions for a suite of standardised monitoring protocols, be able to use web-based applications in the field to record data and have access to web-based portals for data curation. The standardised monitoring protocols will be used to support future DAWE NRM programs that benefit the environment, farms, and communities. In addition, the protocols will be available for use by other environmental land managers and environmental consultants. This presentation explores the first set of (draft) protocols delivered to DAWE in May 2021, including Plot Selection and Layout, Plot Description, Photopoints, Floristics, Plant Tissue Vouchering, Cover, Vegetation Mapping and Opportunistic Observations.
Standardising environmental monitoring protocols and data systems for improved decision-making (2nd set of protocols)
Mark Laws, Kimberly McCallum, Julia Bignall, Sally O’Neill and Ben Sparrow
Conservation and restoration programs and environmental impact assessment decision-makers need access to consistent, comparable data across programs, jurisdictions and ecosystem types to understand change and effectively inform natural resource management (NRM) and conservation decision-making. TERN is working with the Department of Agriculture, Water and the Environment (DAWE) to co-design standardised ecological monitoring protocols and a data exchange system. The new protocols build on TERN’s data aggregation systems and well-tested field survey protocols. TERN has produced a set of modular methods implemented at over 700 monitoring plots Australia-wide since 2012. A modular approach to the protocols will efficiently enable individual projects to collect information that is relevant to their project, whilst not requiring the collection of information beyond the scope of their project needs. This project will ensure service providers and ecologists collecting field data have ready access to comprehensive instructions for a suite of standardised monitoring protocols, be able to use web-based applications in the field to record data and have access to web-based portals for data curation. The standardised monitoring protocols will be used to support future DAWE NRM programs that benefit the environment, farms, and communities. In addition, the protocols will be available for use by other environmental land managers and environmental consultants. This presentation explores the second set of (draft) protocols to be delivered to DAWE in November 2021, including Condition, Coarse Woody Debris, Recruitment, Basal Area, Soils, Fire, Vertebrate Fauna, Invertebrate Fauna, Targeted Surveys, Camera Traps and Interventions.
The value of standardised field survey methods for researchers
Dr Kimberly McCallum, Mark Laws, Julia Bignall, Sally O’Neill and Ben Sparrow
Standardising ecological field survey methods results in datasets that can be compared across projects and locations, and, when methods are developed and approved by a variety of scientists and land managers, allows end users to be confident in the quality of the data collected. To maximise the value of standardised field surveys, protocols should be scientifically robust but also practical, with a focus on well-defined, precise, quantitative and repeatable measures. Data collected in this way allows direct comparisons over a range of spatial and temporal scales, and facilitates assessment of management interventions, land management activities and climate change impacts, as well as focus areas for conservation projects.
In the past, large-scale ecological monitoring programs were hampered by a lack of suitably standardised methods. To help fill this gap, TERN was established, and standardised methods for the collection of soil and vegetation data and samples across Australia were developed. Building on this, TERN is working with the Department of Agriculture, Water and the Environment to develop a suite of nationally standardised protocols for improved decision-making in conservation programs and environmental impact assessments, including condition, recruitment, fire, targeted and fauna surveys protocols.
The data collected by TERN is freely available and can be used for a variety of studies ranging from population genetics through to remote sensing. Datasets have already been utilised for a wide range of research including community ecology and plant functional trait analysis, remote sensing validation, isotope studies and assessment of soil microbial diversity. The standardised collection methods employed by and currently under development by TERN allows data to be collected in a precise and objective manner, which means that researchers using datasets or samples, can be confident in how they were collected and any uncertainty due to observer variation or the methods used are minimised.
How can objective, standardised data collection increase the efficiency of assessments under the EPBC act?
Bethany Cox
Ecosystem monitoring is essential for assessing the efficacy of environmental action which reflects the legislation relating to the management of our natural resources. Absence of consistent, authoritative data that considers cumulative impacts spatially and temporally, creates an inability to understand the successes and failures of environmental management practices such as those highlighted in the recent independent review of the Environment Protection and Biodiversity Conservation Act 1999 (Samuel, 2020). Ecosystem monitoring is particularly relevant to the evaluation of both federal and state legislation. Policy changes are informed by the collection, analysis and reporting on the state of the environment across Australia (Jackson et al, 2016). Presently, there is no national supply chain for environmental monitoring information, with monitoring often fragmented between states, organisations and individuals. A lack of coordination, an absence of data sharing and no minimum requirements for data collection has led to inadequate data capture; preventing informed decision-making. I will discuss how the standardisation and streamlining of quantitative measures using clearly defined data systems will improve access to quality data from which to make informed decisions.
References
Samuel, G 2020, ‘Independent Review of the EPBC Act – Final Report’, Department of Agriculture, Water and the Environment, Canberra, vol. October. CC BY 4.0.
Jackson WJ, Argent RM, Bax NJ, Bui E, Clark GF, Coleman S, Cresswell ID, Emmerson KM, Evans K, Hibberd MF, Johnston EL, Keywood MD, Klekociuk A, Mackay R, Metcalfe D, Murphy H, Rankin A, Smith DC, Wienecke B 2016, ‘Overview: Overview. In: Australia state of the environment 2016’, Australian Government Department of the Environment and Energy, Canberra.
Session Five: Soils and Ecosystem Function
Enabling soil data reuse for ecosystem management and decision making: A standards-based approach
Dr Megan Wong
Soil data forms an important part of monitoring, evaluating, reporting, and improving land use and management. However, discovering, accessing, and using soil data of varying quality, vintages and from multiple sources presents significant challenges for Farming Systems and Catchment Management Groups. Custodians store widely variable content (e.g. chemical, physical, biological) in multiple formats and structures (such as databases, pdfs and excel tables) with poorly documented content meaning.
Visualising Australasia’s Soils (VAS) enables soil data custodians to re-discover and access their legacy soil data in a standard format (using Observations and Measurements patterns) and standard content (using Controlled Vocabularies such as http://registry.it.csiro.au/def/soil). VAS allows data discovery, visualization, analysis and download via a web portal (https://data.soilcrc.com.au). The portal uses Application Programming Interface (API) endpoints that, subject to data-owner access permissions, provide JSON-LD contexts for observations (based on the observed property, procedure used or feature of interest), sites (such as plots, pits, paddocks), specimens and soil features (layers, horizons, profiles, bodies) using the W3C Semantic Sensor Network (SSN) ontology.
Describing and delivering data in this standard way makes the data more findable, accessible, interoperable and re-usable (FAIR). VAS allows re-use of potentially lost legacy data for monitoring, reporting, benchmarking, tooling, modelling and machine learning. The data is more amenable to harmonisation and integration across space and time, for example by the procedure used or project.
VAS faced considerable challenges in converting, understanding, and uploading the data providers’ historical data due to the broad range of data variables/elements, formats, structures, and quality of the holdings.
Future work is required to improve this process by developing custodian-based data capture mechanisms to make their data discoverable and accessible through VAS. Further refining user functionality and ease of use will help meet the monitoring, reporting, and benchmarking soil data use cases.
Spatially explicit estimates of brown and blue carbon stocks in Australia’s terrestrial and coastal marine biomes
Dr Lewis Walden
Quantifying soil organic carbon storage across terrestrial and marine ecosystems is critical for determining current and future climate change mitigation potential of Australian soils. Organic carbon stored in soils are important in global climate change mitigation efforts. Current estimates of organic carbon stocks in Australia are derived separately for terrestrial, coastal, and tidal systems. Here, we collated and harmonised measurements of the 0–30 cm soil organic carbon stocks from Australia’s diverse terrestrial and coastal ecosystems and modelled the stocks simultaneously. For the modelling, we used a regression trees algorithm and an exhaustive set of 20spatially explicit predictors that represent climatic, soil, vegetation, terrain and oceanographic variables. The advantage of the algorithm is that it partitions the data into different regions with similar environmental characteristics, and then derives different local models for each of those partitions. We found that the model grouped regions according to their mean carbon density. For example, forested regions with large mean stocks were grouped, regions in the coastal habitats were separate from terrestrial systems, and the rangelands of inland Australia were also grouped. Native habitats (forests, tidal marshes and mangroves) have the largest mean soil organic carbon density and may be the most vulnerable to carbon loss with climate change and land management. Soils with smaller mean carbon density typically occur in the semi-arid and arid regions of the country and cover much larger extents.
Our results suggest the need for the development of regional strategies for climate change mitigation via the protection, conservation, and restoration of terrestrial and marine ecosystems in Australia. The consistently derived estimates of the terrestrial and marine stocks might help to support Australia’s National Carbon Accounting System, guide the formulation of policy around carbon offset schemes, improve Australia’s carbon balances.
Updating the Australia’s digital soil mapping products: Soil texture case study
Dr Brendan Malone
This research contribution presents new efforts to update the soil texture maps for Australia (Version 1 was delivered in 2015) which is part of the broader program to update and improve the countries soil information infrastructure.
Not only is there new data on hand and a slightly different spatial modelling approach, the main distinguishing enhancement to what we will refer to as Version 2 products is the merging of field descriptions of soil texture with the traditional laboratory analysed data. We propose a fit for purpose algorithm to convert categorical soil texture data into quantitative measures. We also propose custom methodology to deal with the associated uncertainties of these conversions and how these can be propagated in any sort of spatial modelling
We first describe our efforts to re-calibrate the soil texture class centroids that were first determined by Minasny et al. (2007). Then we describe our approach for using these centroids and their uncertainties for generating plausible soil texture fractions for all qualitative soil profile texture descriptions contained in Australian soil databases.
The next phase of the research details the renewed efforts to update the Version 1 soil texture products, that incorporates both data types and modification to the spatial modelling approach which is more rigorous in terms of treatment of compositional data.
Version 2 products are statistically more accurate than Version 1 products based on independent validation. Version 2 products were also compared to recently released Version 2 World Soil Grids products. These new products will enhance our abilities to characterises key soil functions such as soil water storage and transport and the cycling of soil carbon.
Filling the ecosystem monitoring gaps in TERN: making Western Australian SuperSites more super
Dr Caitlin Moore
Australia’s terrestrial ecosystem observation capacity supported by TERN provides critical measurements of ecosystem health, and how ecosystems respond to climate variability and change. In the Ecosystem Processes platform of TERN’s Observatory, eddy covariance towers record fluxes of carbon, water and energy between the ecosystem and atmosphere. Combined with a suite of measurements periodically collected to inform on plant structure and biodiversity, these towers form a core part of what defines a SuperSite. However, gaps exist within the SuperSite framework that need to be addressed to more completely capture changes in ecosystems over time. These include the need for better stress detection systems that link with ecosystem productivity, reducing temporal gaps in plant structural measurements, increasing biodiversity monitoring over spatial gradients, improving understanding of how sunlight moves through the plant canopy, and enabling better scaling from sites to region using remote sensing and modelling.
This presentation details recent activities to improve ecosystem monitoring in Western Australia (WA), facilitated through a co-investment in TERN from the WA state government. New instrumentation has been installed to address measurement gaps at WA’s three TERN SuperSites – a Wandoo woodland at Boyagin Reserve, the Salmon gums of the Great Western Woodlands, and the coastal banksia heath of Gingin. These ecosystems are unique to WA and are identified as sentinel systems for environmental change. The new instrumentation includes fixed terrestrial laser scanners to capture daily changes in vegetation structure, hyperspectral sensors to calculate vegetation indices and measure sun-induced chlorophyll fluorescence (SIF), and quantum sensor nodes to record variability of photosynthetically active radiation scattering and absorption through the canopy. These measurements will improve our understanding of vegetation stress and structural change as climate variability increases, provide synergies across the Landscapes and Ecosystem Surveillance platforms in TERN’s Observatory, and allow for greater integration with novel satellite technologies.
Litterfall dynamics: developing a national dataset of daily fall rates and associated algorithms
Dr Alison Specht and John Carter
Litter fall (leaves, twigs, bark and flowers and fruits) is an important component of the total nutrient, energy and carbon budget of the plant community, but the spatial and temporal availability of the data is too sparse to interpolate at a continental level without associated measurements. The litter pool in grasslands, savannas and forests strongly influences the water balance by control of soil evaporation and is a major source of fuel for fires. Despite many individual studies the inter annual and seasonal dynamics of litter input to this pool is poorly quantified for use in daily timestep models running at a continental scale. This paper discusses an approach to fill this gap. Data have been acquired for more than 50 sites around Australia. Where possible data were converted to daily rates (kg/ha/day/litter) for each collection interval. These data were further normalised to litter fall per unit foliage projective cover (FPC). The AussieGRASS model was used to extract daily climate data, e.g. rainfall, temperature, solar radiation and a number of other predictor variables such as soil water index and transpiration at each collection site. These data were then averaged across sites and times. This data set provides information to check annual models of litter fall, develop a simple model of litter fall seasonality, and more importantly provide a data set (and its statistics) for calibrating and validating other and more complex litter fall models. We shall discuss the challenges to incorporate these data in our national accounting, including (a) the availability and quality of data, (b) the variable lag phase between climatic conditions and leaf fall (in particular), and (c) the effect of fire and other extreme events. We shall also discuss the relevance of this work, and value in improving data quality and quantity.
Reducing Australia’s greenhouse gas emissions through soil management
Prof Peter Grace
A small annual increase in soil organic carbon (SOC) over Australia’s agricultural landscapes could potentially offset Australia’s greenhouse gas emissions from all sources. The lack of long-term field trial data on the impact of innovative practices (e.g. adaptive management grazing and legume species) to increase productivity and SOC is a major constraint to reducing Australia’s greenhouse gas budget. An additional constraint is the high cost of verifying small changes in SOC in landscapes with inherent variability in soil and plant production. This has placed greater emphasis on the acquisition of high temporal resolution, spatially integrated greenhouse gas flux data from “benchmark” monitoring sites throughout the agricultural sector. These benchmark sites provide the comprehensive calibration and validation data for simulation models to predict changes in SOC in response to management over time. The carbon dioxide flux data at benchmark sites underpins the rapid identification of carbon sequestration trajectories i.e. whether the management practice is actually storing carbon in this environment, without having to wait many years (to decades) for a significant result. The same benchmark sites can used to collect the non-carbon dioxide emissions data required for full cost C accounting (i.e. nitrous oxide from urine and manure and methane from livestock) and testing novel methods for reducing the cost of SOC assessment. TERN is ideally positioned to provide these benchmark sites in collaboration with industry.
Soil carbon isotopic proxies for determining the photosynthetic pathway of floral communities: A method inter-comparison
Rachel Atkins
The ability to accurately estimate changes in C₃ and C₄ vegetation cover across ancient landscapes will help us to determine how plants that use different photosynthetic pathways responded to climate change in the distant past. This knowledge enables us to make predictions about the influence of future climate change on today’s floral communities. The carbon stable isotope values (δ¹³C) of soil organic matter (SOM) and long chain n-alkanes are commonly used for determining the proportion of C₃ and C₄ vegetation cover in palaeoenvironmental reconstruction. However, the relative accuracy of these two methods has not been rigorously tested. Therefore, we compared the C₄ cover estimates derived from both SOM and soil n-alkane δ¹³C with modern ground vegetation surveys to evaluate the comparative accuracy of each method and determine if they can be used interchangeably for palaeoenvironmental reconstruction. Surface soil samples were collected from 20 TERN plots along a North to South transect through central Australia. We found soil organic matter- and n-alkane-derived estimates of proportional C₄ cover were positively correlated with the C₄ cover estimates calculated using vegetation survey data. The C₄ estimates derived for each method also produced similar trends with climate; as the climate became warmer, the abundance of C₄ cover increased. These results demonstrate that either isotopic approach can be used to reconstruct palaeovegetation without concern for variance associated with a particular method.
Carbon and water exchange in a plantation during initial years of growth
Marcela De Freitas Silva
Eucalyptus globulus (blue gum) represents 51.7% of all plantation trees for hardwood production in Australia, and the largest planted areas are in South Australia and Victoria. Blue gum stands grow in a range of different environments with distinct climates and water availability; thus, they are extensively planted for large scale commercial plantations. Especially in semi-arid regions, the expansion of E. globulus plantations concerns governments because of their high water use. Factors including population growth and limited precipitation rates result in pressure for regulating water allocation for commercial plantation activity. Water accounting models for plantation establishments have been developed in South Australia over an 11-years management cycle. The models are based on limited experimental evidence on mature plantations, with insufficient information regarding the water use and growth of stands in the early years after establishment. Thus, management practices are difficult to be defined over the entire management cycle. This study aims to quantify the water use and carbon assimilation in a blue gum plantation in the first few years after establishment. Energy and carbon fluxes above the tree canopy during the first 3 years after planting were measured in a plantation in southwestern Victoria, Australia. The results reveal that dynamics of evapotranspiration and carbon flux resulted in increases in water use efficiency (WUE) over time. During the first two years, understory transpiration and soil evaporation had a major impact in the total evapotranspiration (ET) and net ecosystem exchange (NEE) of the site. After that period, trees grew enough to dominate the contributions to NEE, with the plantation becoming a more consistent carbon sink during the entire year, while maintaining ET at similar levels to the first two years.
Session Six: The Role of Ecosystem Data in Australia’s Society
An Online Portal for Accessible OzFlux Data
Hoang Long Nguyen
TERN’s Gingin OzFlux Supersite has been working with our Masters class of Environmental Engineering Design students at UWA, to develop a data-exploration platform.
The aim of the platform is to help stakeholders, including the general public, to explore and learn from the data collected at Gingin.
The platform is available online. The platform is focused on the topic of groundwater recharge from the Banksia woodland to the water supply aquifers below. This topic was identified as a priority by numerous stakeholders.
The online platform introduces the Gingin site and allows users to engage with the data in a variety of ways. For example, users could interact with a guided “storyboard” that explains the recharge process and its variability. Alternatively, they could explore user-driven “dashboards” which allow self-guided manipulation of environmental datasets.
Building the platform required overcoming several technical challenges: analysing the OzFlux data from Gingin to understand the recharge process; visually representing the important parts of this story; and developing a workflow to update the data access, analysis, visualisation and web-hosting.
The workflow could be easily adapted to focus on different topics and sites. Our class hopes it might inspire other TERN and/or OzFlux sites to build their own outreach platforms, and we’re happy to share templates, videos explaining how to use the specialised tools we relied on, and code.
The TERN SoilDataFederator
Ross Searle
Soil is a critical component of all ecosystems. Knowledge and understanding of its function and properties is vitally important in ecosystem management. Australia is fortunate to have a large amount of soil profile data observations and measurements publicly available. However, this data is collected and managed by a broad range of custodians across the country. These custodians collect the data for their own specific business purposes and manage it in a disparate range of data systems. Until now, individuals wanting to bring this data together in a unified way had to source data from each of the individual custodians on a case by case basis. A challenging process for most ecologists.
At a conceptual level, there is a broad spectrum of approaches through which data unification can be achieved, from the creation of a centralised data warehouse through to the case by case collation of datasets. The “SoilDataFederator” is a federation approach to data unification, where data is made available and managed by custodians but is federated on the fly to into a consistent form.
The SoilDataFederator is a web application programming Interface (API) implemented in the R programming language and the code is publicly available. The API is used to query data over the internet via a standardised set of URLs with standardised parameters. Data can be returned in a range of formats but always in a standard form optimised for delivering data on a per attribute basis. The SoilDataFederator manages a catalogue of available datasets and a series of associated “backend” modules which query the individual data systems and transform the data on the fly to the standard form.
The SoilDataFederator significantly eases access to soil data and enhances our ability to use this data for understanding and managing ecosystems.
The detection of socio-economic impacts of protected area creation
Alison Specht, Pedro Correa, Rodolphe Devillers,Yasuhisa Kondo, Jeaneth Machicao,
David Mouillot, Yasuhiro Murayama, Shelley Stall, Jamie Trammell, Danton
Vellenich
A fundamental concern of the science and policy agenda is the effect of global changes on the world’s ecosystems and the cascading consequences on human societies. Under this uncertain future, protected areas (PAs) can contribute directly or indirectly to socioeconomic outcomes such as food security and development opportunities for nearby human societies. This subject is being addressed in the Belmont Forum funded PARSEC project (www.parsecproject.org), with funding partners from France, the USA, Brazil, Japan, and associates in Australia. In this presentation we shall discuss some interim results and challenges through examples from Australia, Brazil and the USA. The approach stems from recent research demonstrating the ability to predict socioeconomic conditions using satellite imagery and deep-learning algorithms1,2. Firstly we identify areas with PAs for which we can obtain satellite images before and after their creation. We have been using the World Database for Protected Areas (WDPA) for our main source, validating this against national information. Once PAs are selected, these, and the surrounding villages and towns, will be mirrored with areas without PAs. Concurrently we have been identifying the sources of socio-economic information that will allow training of the satellite images to identify socio-economic indicators. The PARSEC project brief also includes a strong thread of data management with data scientists working alongside the research process described above. We shall briefly outline our ongoing data and digital object management approach, within which we have identified tools which assist active international collaboration as well as ensuring good data management practices. This is integral to the success of the project and enables the results (including any codes created) to be properly reported and lodged in open-access repositories.
1. Jean, N. et al. (2016) https://doi.org/10.1126/science.aaf7894 2. Yeh, C., et al. (2020) https://doi.org/10.1038/s41467-020-16185-w
Where citizen science meets the built environment: the schools weather and air quality (SWAQ) network
Dr Melissa Hart
Sydney’s population is predicted to grow by 30% within twenty years, most of which is slated for the semi-rural fringes. The resulting urbanisation will adversely impact temperature and air quality in these areas of rapid population growth. Both temperature and air quality can vary greatly within cities themselves due to spatial variability in land-use, surface characteristics, pollutant emissions, transport infrastructure and the geography of the city. Therefore it is imperative to have high density meteorological and air quality observations across a city. This presentation will discuss the development of a citizen science project, SWAQ (schools weather and air quality), that has placed meteorology and air quality sensors in schools across Sydney. The sites complement existing networks in order to target regions lacking monitoring sites e.g., urban growth areas on the rural fringe. Students analyse this research quality data in science and maths curriculum-aligned classroom activities. The data will also be freely available online to researchers.
Session Seven: Good Data and Models for Good Science and Management
Enabling FAIR Flux Data in TERN
Anusuriya Devaraju, Peter Isaac, Cacilia Ewenz, Ian McHugh, Jenny Mahuika, Gerhard
Weis, Edmond Chuc, Mirko Karan, Siddeswara Guru
Systematic management of scientific data, from collection to publication, requires standardized processing, quality control, curation, and long-term storage. TERN research infrastructure is committed to the continuous provision and long-term preservation of data generated from its observing platforms. Eddy covariance datasets (i.e., measures of energy, carbon and water exchange between the atmosphere and ecosystems) generated from the TERN Ecosystem Processes (EP) flux monitoring sites and the associated sites of the OzFlux network are critical assets to help researchers understand the impact of climate change on ecosystems across Australia. In the spirit of the FAIR (Findable, Accessible, Interoperable, and Reusable) data principles, the TERN Data Services and Analytics (DSA) and EP are working together to streamline data management practices to publish time-series flux data. This talk will provide an overview of the implementation and the progress made using the agreed-upon practices for managing flux data. The practices focus on data processing and curation workflows, data and metadata standardization, controlled vocabularies to describe associated data artefacts, the strategy applied for publishing time-series data using persistent identifiers and efforts to comply with the FAIR principles. The proposed approach will contribute to a sustainable, scalable flux data management in TERN, and we believe the practical experiences can offer valuable information to other research infrastructures managing time-series sensor data. Finally, the talk will offer insights into how this work may contribute to building collaborations across inter-continental micrometeorological flux observation programs.
TERN observatory synergies for scaling carbon pool and flux observations with remotely sensed data: Current activities and next steps
Dr William Woodgate
This presentation highlights synergies between all three TERN observatories for scaling carbon pool and flux estimates in Australian ecosystems.
A new TERN Landscapes project facilitates the systematic collection of Terrestrial Laser Scanning (TLS) datasets at core TERN Ecosystem Processes sites, with the overarching objective to develop the first comprehensive 3D digital twins, i.e., genuine 3D abstractions, of a representative selection of Australia’s diverse forest types. These 3D representations are intended to serve a broad suite of purposes across a range of research domains.
When complemented by state-of-the-art 3D radiative transfer modelling (RTM), various forest structure and biomass retrieval methods at canopy to continental scales can be quantitatively assessed using RTM simulated Earth observation (EO) signals (e.g., air-/space-borne LiDAR and optical imagery). This is especially important for Australia’s unique vegetation structure (i.e., highly clumped, vertically inclined leaves). The framework will allow for any type of active or passive LiDAR or optical sensor to be simulated, which includes current instruments, e.g., NASA’s space-borne LiDAR GEDI, or be used to model and predict the performance of future planned sensors. In addition, these realistic 3D models will assist parameterising the new wave of Earth System models with increasing canopy structure complexity.
Another application of TLS-based 3D forest abstractions is to investigate structural attributes at unprecedented levels of detail, such as tree morphology and phylogeny. Such data is highly complementary to traditional plot-based inventories provided by the TERN Ecosystem Surveillance. Lastly, possible synergies with new proximal hyperspectral sensing systems co-located at flux towers will be discussed. These proximal systems fill an existing spatiotemporal gap (sub-daily and sub-plot resolution) between early generation sun-induced fluorescence (SIF) space missions and hyperspectral satellites, thus facilitating the next wave of research into remote measurement methods of canopy productivity, phenology, and other biophysical attributes (leaf chlorophyll, nitrogen content, LAI etc.).
The NEON Ecological Forecasting Challenge: Using forecasting challenges to leverage observational networks and advance prediction in ecology
Dr Quinn Thomas
Forecasting challenges, in concert with increased data availability from sensors and observational networks, can improve our predictive understanding of ecological dynamics by providing a focal point for developing forecasts using a diversity of approaches. To this end, the Ecological Forecasting Initiative Research Coordination Network is hosting the National Ecological Observatory Network (NEON) Ecological Forecasting Challenge. As continental-scale observatory, NEON has standardized measurements across 81 sites that include terrestrial and aquatic ecosystems. Leveraging these standardized measurements, the Challenge provides protocols, standards, and cyberinfrastructure for submitting forecasts for multiple time-series datasets before NEON collects the data. The Challenge has five themes that engage the community in forecasting populations (ticks), communities (beetle abundance and diversity), and ecosystems (plant phenology, lake/stream temperature and dissolved oxygen, and terrestrial carbon and water fluxes) and has been running since January 2021. This talk provides an overview of the Challenge along with lessons learned that can be applied to observations from TERN. It also highlights how such challenges can advance our synthetic understanding of predictability across different ecological system and scales while formalizing best practices that maximize forecast utility for society.
Plants down under: defining and mapping the photosynthetic pathway of plants across Australia
Dr Samantha Munroe
As the climate in Australia changes, plants using different photosynthetic pathways (i.e. C3, C4, CAM) must adapt to these new climate conditions, ‘migrate’ to new habitats, or will disappear entirely. However, our ability to monitor and respond to these changes is hindered by a lack of data on the pathways of different species, as well as their distribution and cover in distinct plant communities. This urgent problem drove the creation of a new data set that lists the photosynthetic pathway of > 2400 Australian species recorded across entire TERN’s national plot network. This photosynthesis pathway data set was created by first listing every unique species recorded during field surveys conducted by TERN’s Ecosystem Surveillance platform. This list was then compared to over 30 peer-reviewed resources investigating the photosynthetic pathway of plants to assign ~ 2000 species to their correct pathway. To determine the pathway of > 400 species not previously assessed, we used vegetation samples collected at TERN surveillance plots and performed carbon stable isotope analysis (δ13C). This analysis measures the ratio of heavy to light carbon (13C/12C) in plant tissue, which demarks plants as using either C3 or C4 photosynthesis. In addition to information on individual species, these data can be used in conjunction with TERN surveys to study the occurrence and abundance of pathways across the continent. We have developed convenient code for the R environment which enables scientists to quickly and easily calculate % C4 and C3 cover at TERN plots. These data and techniques have already been used to relate C4 cover in different taxa to changes in climate and local factors. These freely available data and tools have numerous other valuable applications, including investigating fractional productivity and carbon exchange or the impacts of global warming on vegetation abundance.
Using TERN products to predict habitat condition nationally
Dr Kristen Williams
The Commonwealth Scientific and Industrial Research Organisation (CSIRO) and the Australian Government Department of Agriculture, Water and the Environment (DAWE) have been collaborating on the development of a national habitat condition assessment system (HCAS) since 2015. The overarching framework for the method was published in an international scientific journal in 2016 (Harwood et al., 2016; Methods in Ecology and Evolution 7(9), 1050-1059, DOI: 10.1111/2041-210X.12579) and has since been incrementally improved through two trial implementations: HCAS v2.0 (Williams et al., 2020) and HCAS v2.1 (Williams et al., 2021). HCAS is addressing the need for nationally consistent, landscape-wide, site-level estimates of habitat condition, to inform the conservation of Australia’s wildlife and natural heritage. The approach developed by CSIRO and DAWE aims to predict the quality of (mainly terrestrial) habitats in terms of their capacity to support the native species once occurring there naturally.
HCAS has been enabled by TERN products which support two of the three sets of inputs:
• remotely sensed data on seasonal variation in vegetation attributes such as cover, litter and bare ground, and
• environmental information about soils, climate, surface water and landforms.
Additionally, data on ‘reference sites’, locations in natural areas that are the least modified examples of their type, are needed to train the model.
Here we present the results of HCAS v2.1 and discuss how further development of TERN products can contribute to improve the accuracy of habitat condition predictions nationally.
Technical reports cited:
1. Williams et al (2020) Habitat Condition Assessment System: developing HCAS version 2.0 (beta). A revised method for mapping habitat condition across Australia. Publication number EP21001. CSIRO, Canberra, Australia.
2. Williams et al (2021) Habitat Condition Assessment System (HCAS version 2.1): Enhanced method for mapping habitat condition and change across Australia. CSIRO, Canberra, Australia.
An inclusive approach to develop community capability for environmental conservation in Lake Biwa (Japan)
Yasuhisa Kondo
In the south basin of Lake Biwa, Shiga, Japan, overgrown aquatic weeds impede cruising boats and cause unpleasant odours and undesirable waste when washed ashore. To address this socio-ecological problem, the local government implemented a public program to remove overgrown weeds and compost them ashore to conserve the lake environment, while coastal inhabitants and occasional volunteers remove weeds from the beaches to maintain the quality of the living environment. However, these effects are limited because of disjointed social networks. The author’s team worked as external action researchers to facilitate developing community capability to jointly address this problem by sharing academic knowledge with local actors and empowering them with an inclusive, adaptive, and abductive intent. In practice, the team held multi-actor workshops with local inhabitants, governmental agents, businesspeople, social entrepreneurs, and research experts to unearth the best solution. The workshops resulted in developing an e-point system, called Biwa Point, to promote and acknowledge voluntary environmental conservation activities, including beach cleaning. A non-profit organisation launched to implement and manage the Biwa Point system. This process was characterised by the dynamic organisation of actors of interest and their initiative to make decisions. This action research also arose ethical issues, such as the publication of inconvenient truths, undesired interpretation by the researchers, and social constraints in research methods.
Paratoo: Next-Generation Field Data Collection Infrastructure
Dr Andrew Tokmakoff
In the early-mid 2010’s, TERN Ecosystem Surveillance developed the AuScribe App and associated backend ingestion and curation tools; the system has been in production and under active maintenance since 2014.
AuScribe’s key function is to ensure correctness and completeness of data collected in the field according to the AusPlots Rangelands field data collection protocol. This reduces the need for elaborate and time-consuming curation activities, thereby offering the team efficiency and productivity gains.
This solution has been working well, and remains in service. However, the underlying technology base for the system is starting to show its age, and we are now Engineering a next-generation system that offers:
– Improved adaptability of the User-Interface over devices (UI’s that scale from desktop to mobile, in a single code-base)
– More accessible web-based technologies (as opposed to native App development, which makes staffing simpler)
– Containerised backend systems (to allow for simple and repeatable system migration),
– A generic design which allows for the addition of Field Data Collection to existing systems (which have their own project and user management systems already in-place).
In this talk, we will outline the design and technology-choices that have been made for “Paratoo”, our next-generation field data collection system, offering a technical glimpse of what’s currently under active development.
Bushfire data commons
Dr Adrian Burton and Dr Sheida Hadavi
The Australian Research Data Commons (ARDC) is a NCRIS facility, providing Australian researchers with competitive advantage through data. The Translational Research Data Challenges program is a new national-scale ‘flagship’ initiative providing innovative and high-impact digital infrastructure solutions to real-world problems. In response to the acute demand, the first societal problem is ‘Disaster Resilience and Risk Reduction’, with an initial focus on the impact area of ‘Bushfires’. The ‘Bushfire data challenges’ program aims to improve bushfire management by supporting research and development with pathways to advancing operational planning and response.
Collaborating with partners from governments and research institutions the projects address societal problems by removing barriers to the access, analysis and curation of data. The research and development infrastructure is expected to dovetail by design with existing and emerging initiatives from the mature organisations such as TERN, DAWE, GA and CSIRO.
The bushfire data infrastructure have three aspects:
– Aggregated data content
– A framework for aggregating data, establishing a systematic approach towards data sharing and storage
– A platform to provide access, visualisations and modelling tools
ARDC runs 2 phases of the bushfire data challenges:
– modelling bushfire behaviour, with data content on fire history and fuel
– modelling impact, with data content on built infrastructure, health, air quality and environment
As part of this program, TERN leads the work stream on ‘Aggregating and harmonising fuel data on a national scale’. This project aligns with TERN’s national leadership in biomass, and in partnership with DAWE, they would provide a national scale fuel data layer including content, structure and moisture. State agencies and researchers are the other partners and beneficiaries in this project.
In this initiative TERN and the ecosystems science community will address questions of national significance with national scale data infrastructure through joined-up efforts with other leading national players.
Robust scalable data management for EcoImages
Siddeswara Guru, Wilma Karsdorp, Gerhard Weis, Mosheh Eliyahu, Habacuc Flores,
Daniel Sheath, Jenny Mahuika
Advancement in technology has enabled ecosystem science researchers to sense the environment through audio, video and sound. The use of technology has enhanced the frequency of data capture, expand the spatial extent of data collection. However, effective on-time end-to-end management of sensed data is paramount to leveraging data value and derive knowledge. TERN observing platforms use imaging technologies to detect the environment in different sites across Australia. The images collected are from photopoints, phenocamera, camera trap and cameras to estimate LAI. Effective management of these images is essential to leverage the long-term usability and study the changes in the environment.
We will present a web-based TERN Ecoimage platform specifically designed to implement end-to-end data management, including standardised data on-boarding, processing, discovery and access of different image types collected at TERN Ecosystem sites. The platform enables users to search images based on where, when, and what kinds of images collected, download them and mint DOI for their image collection for further reuse.
Session Eight: Open Forum
Assessing resilience of terrestrial ecosystems in Australia across scales
Prof Lance Gunderson
Many social ecological systems are characterized by discontinuous structures and processes across spatial-temporal scales, in a theoretical framework called panarchy. A panarchy is dynamic hierarchy, with spatial and temporal changes occurring across levels. It has been applied to explain cross-scale vegetation changes over time scales of years to centuries at spatial scales from stands to bioregions. Such panarchies have been described for southeastern US forests, US midwestern landscape vegetation changes and managed forests in Sweden. Ecological resilience is related to the distributions of functions within and across scales of a panarchy. We propose a joint research pilot project to assess the interaction between panarchies and cross-scale resilience of monitored ecosystems across Australia. We propose to use data from the Terrestrial Ecosystem Research Network, to analyze status and trends of collected environmental data and use those data to assess the resilience of terrestrial plant and animal communities to long-term environmental changes, such as ongoing global climate change. A variety of approaches, including discontinuity analysis, time-series modeling, spatial analysis and early warning indicators will be used to identify key indicators and proved quantitative estimates of resilience across scales.
Supersites and superorganisms: recurring themes in 85 years of ecosystem science
Prof Ted Lefroy
The word ecosystem arose out of a dispute between two schools of thought amongst ecology’s twentieth century pioneers. Should communities of plants and animals be seen as naturally ordered superorganisms, or loose collections of species and their environment intelligible through the application of reductionist science? Arthur Tansley coined the term in 1935 in support of the latter view. Tansley never carried out ecosystem studies, and until Ray Lindeman published his attempt to track the flow of energy through a North American lake 7 years later, no one in the English speaking world was quite sure what ecosystem science might look like. Large multidisciplinary studies of terrestrial ecosystems received a major boost with the International Biological Program (IBP) in the 1970s, particularly in North America where research was stimulated by increases in science funding and questions about the biological effects of nuclear radiation, with the IBP later extended through its successor the Long Term Ecological Research network (1980-present). The superorganism concept resurfaced in popular culture In 1979 as the Gaia hypothesis. Rejected in its strong form by the scientific community on evolutionary grounds, Gaia has since been invoked in the peer reviewed literature to describe proposed mechanisms of self-regulation. This paper reflects on three recurring themes in the history of ecosystem science; the influence of politics and national interests, the tension between continuity and flexibility, and the elusive nature of general principles.
A DNA Barcode Library for all Named Australian Species
Dr Oliver Berry
Australia’s environment is unique and valuable. But, its size, complexity and high biodiversity mean that it is often expensive and difficult to gather the information we need to manage it effectively.
In the past few years environmental monitoring has been revolutionised by a new technique called “eDNA” (environmental DNA). With eDNA analysis, scientists purify DNA from an environmental sample like water or soil and identify species present from their unique “DNA barcodes”. This happens without needing to see the animal or plant to know it is present. It works because all organisms shed tiny invisible pieces of DNA into the environment constantly and because every species has a unique DNA sequence. eDNA is a very effective way to map the distributions of all types of organisms, especially in water.
Worldwide, governments, industry and even citizen scientists are adopting eDNA because of its high accuracy, its uniquely universal approach that can be applied across the tree of life, and because it is a safe and simple way to sample. However, something is holding eDNA back. To identify a species with eDNA we need to know its unique DNA barcode. Yet, we only know the DNA barcodes for a small fraction of species. This means that when eDNA monitoring is conducted lots of species are not identified because their DNA sequence can’t be correctly assigned. Without a full library of DNA barcodes we can’t make the most of eDNA’s amazing potential to cost-effectively provide the best information on the environment.
CSIRO has created the technology to complete Australia’s DNA barcode library. The platform can generate DNA barcodes for any type of organism, from microbes to birds. We propose to achieve this significant goal in partnership with a consortium of end-users, biodiversity and biosecurity experts, state and federal governments and philanthropic organisations.