The 2022 release of Australia’s Threatened Species Index brings good news and not so good news. Which would you like first?
It’s always a conundrum when someone asks you this. Do you seek the soothing news first and hope it softens the landing? Or do you take the jolt first, wagering that the good news will put you back on an even keel?
Go ahead — take your time to mull it over. While you do, we’ll take a step back and first explain exactly what the Threatened Species Index is.
The Threatened Species Index — or TSX for short — seeks to provide reliable and robust measures of change in the relative abundance of Australia’s threatened and near-threatened species. The TSX is based at the Terrestrial Ecosystem Research Network (TERN) at UQ, and was a key output of the UQ node of the Threatened Species Recovery Hub, run out of the Centre for Biodiversity and Conservation Science (CBCS). It is the brainchild of Prof. Hugh Possingham and was created through super-human efforts of former CBCS research fellows Dr Elisa Bayraktarov, Dr Ayesha Tulloch and Dr Micha Jackson. Today, the index compiles over 19,000 monitoring datasets for threatened and near-threatened birds, mammals and plants, and uses these data to estimate abundance trends using the Living Planet Index method. The TSX is now a key metric for understanding the status of Australia’s biodiversity, being integrated into the State of the Environment report for the first time in 2021 and used by the Australian Government as a report card for its threatened species investments. The index was created with the support of the Australian Government and continues to be part-funded by the Department of Climate Change, Energy, the Environment and Water.
The TSX has had three previous releases, in 2018 (starting life as the Threatened Bird Index), 2019 (with the integration of the Threatened Mammal Index) and 2020 (when the Threatened Plant Index was compiled). Our latest release — which occurred in December 2022 — consolidated the index after its migration to TERN and added significant new data (more on that below).
OK, had enough time to ponder your choices? We’ll assume you have, and that you’ve gone with the default option when the news is mixed — take the not so good news first.
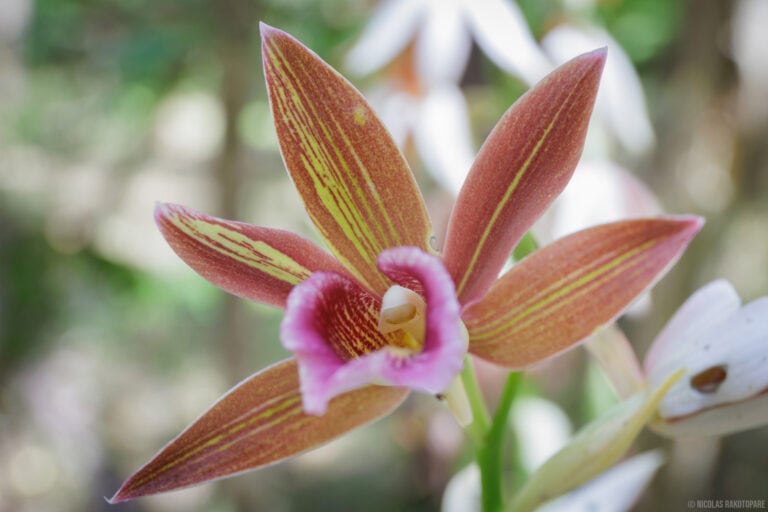
Phaius Australis - Lesser Swamp Orchid
The not so good news
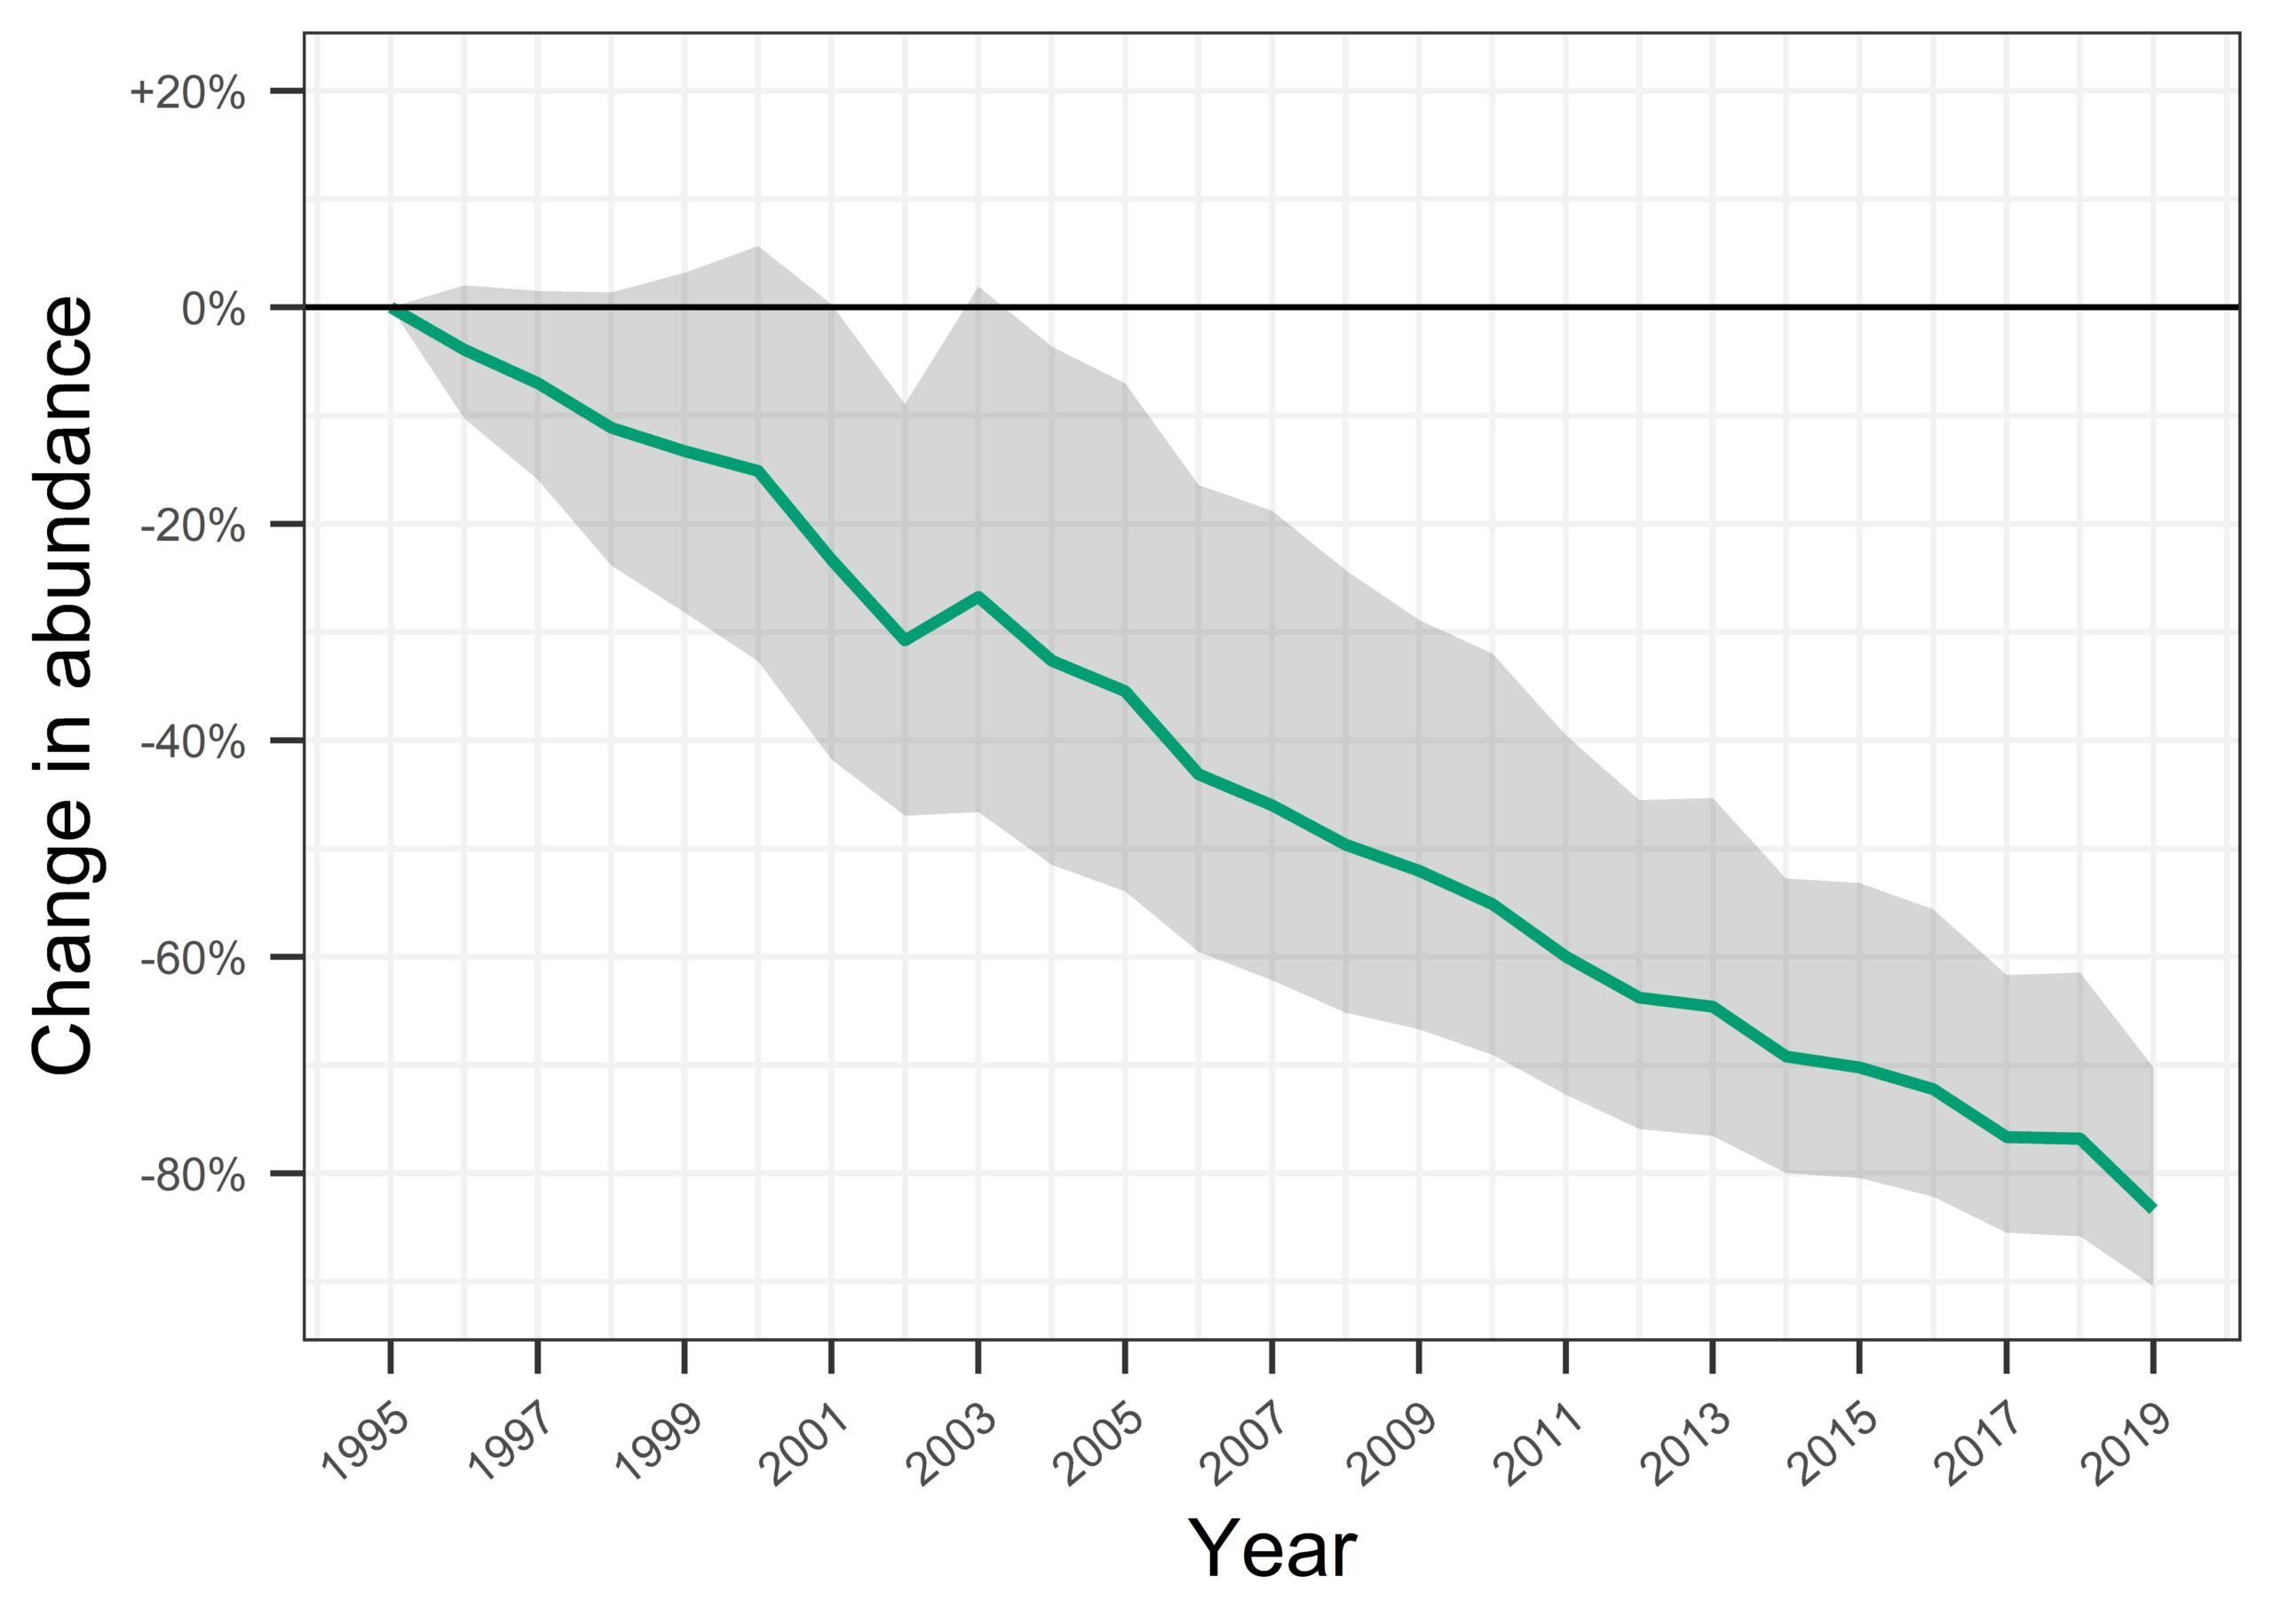
The concerning news from this year’s release is that our threatened and near threatened species continue to decline in abundance, with an average across species from 1985 to 2019 of 55% (Figure 1). For birds, the average decline stands at 48% (across 70 species), with the average for mammals being 19% (across 79 species). Plants are the stand-out, but for the wrong reason — the overall estimate of decline being 77% across the 129 species for which the TSX has data. On average then, the abundance of Australia’s threatened and near-threatened plants is estimated to have reduced by over ¾ since 1985. A statistic that should be of great concern.
Data in the TSX also allow for interrogation of how species groups within the major taxon groups are tracking. Greatest declines were observed among Herbaceous Plants (84% since 2000), Small Mammals <50 g body weight (84%) and Orchids (81%), with significant declines for Terrestrial Birds (66%) and Shrubs (63%).
Figure 1. The Threatened Species Index 2022, showing trends up to 2019 across all species and separately for birds, mammals and plants.
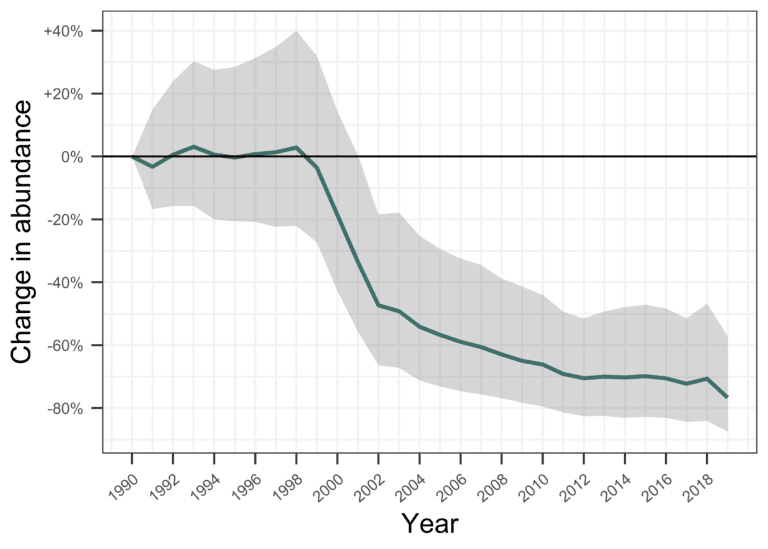
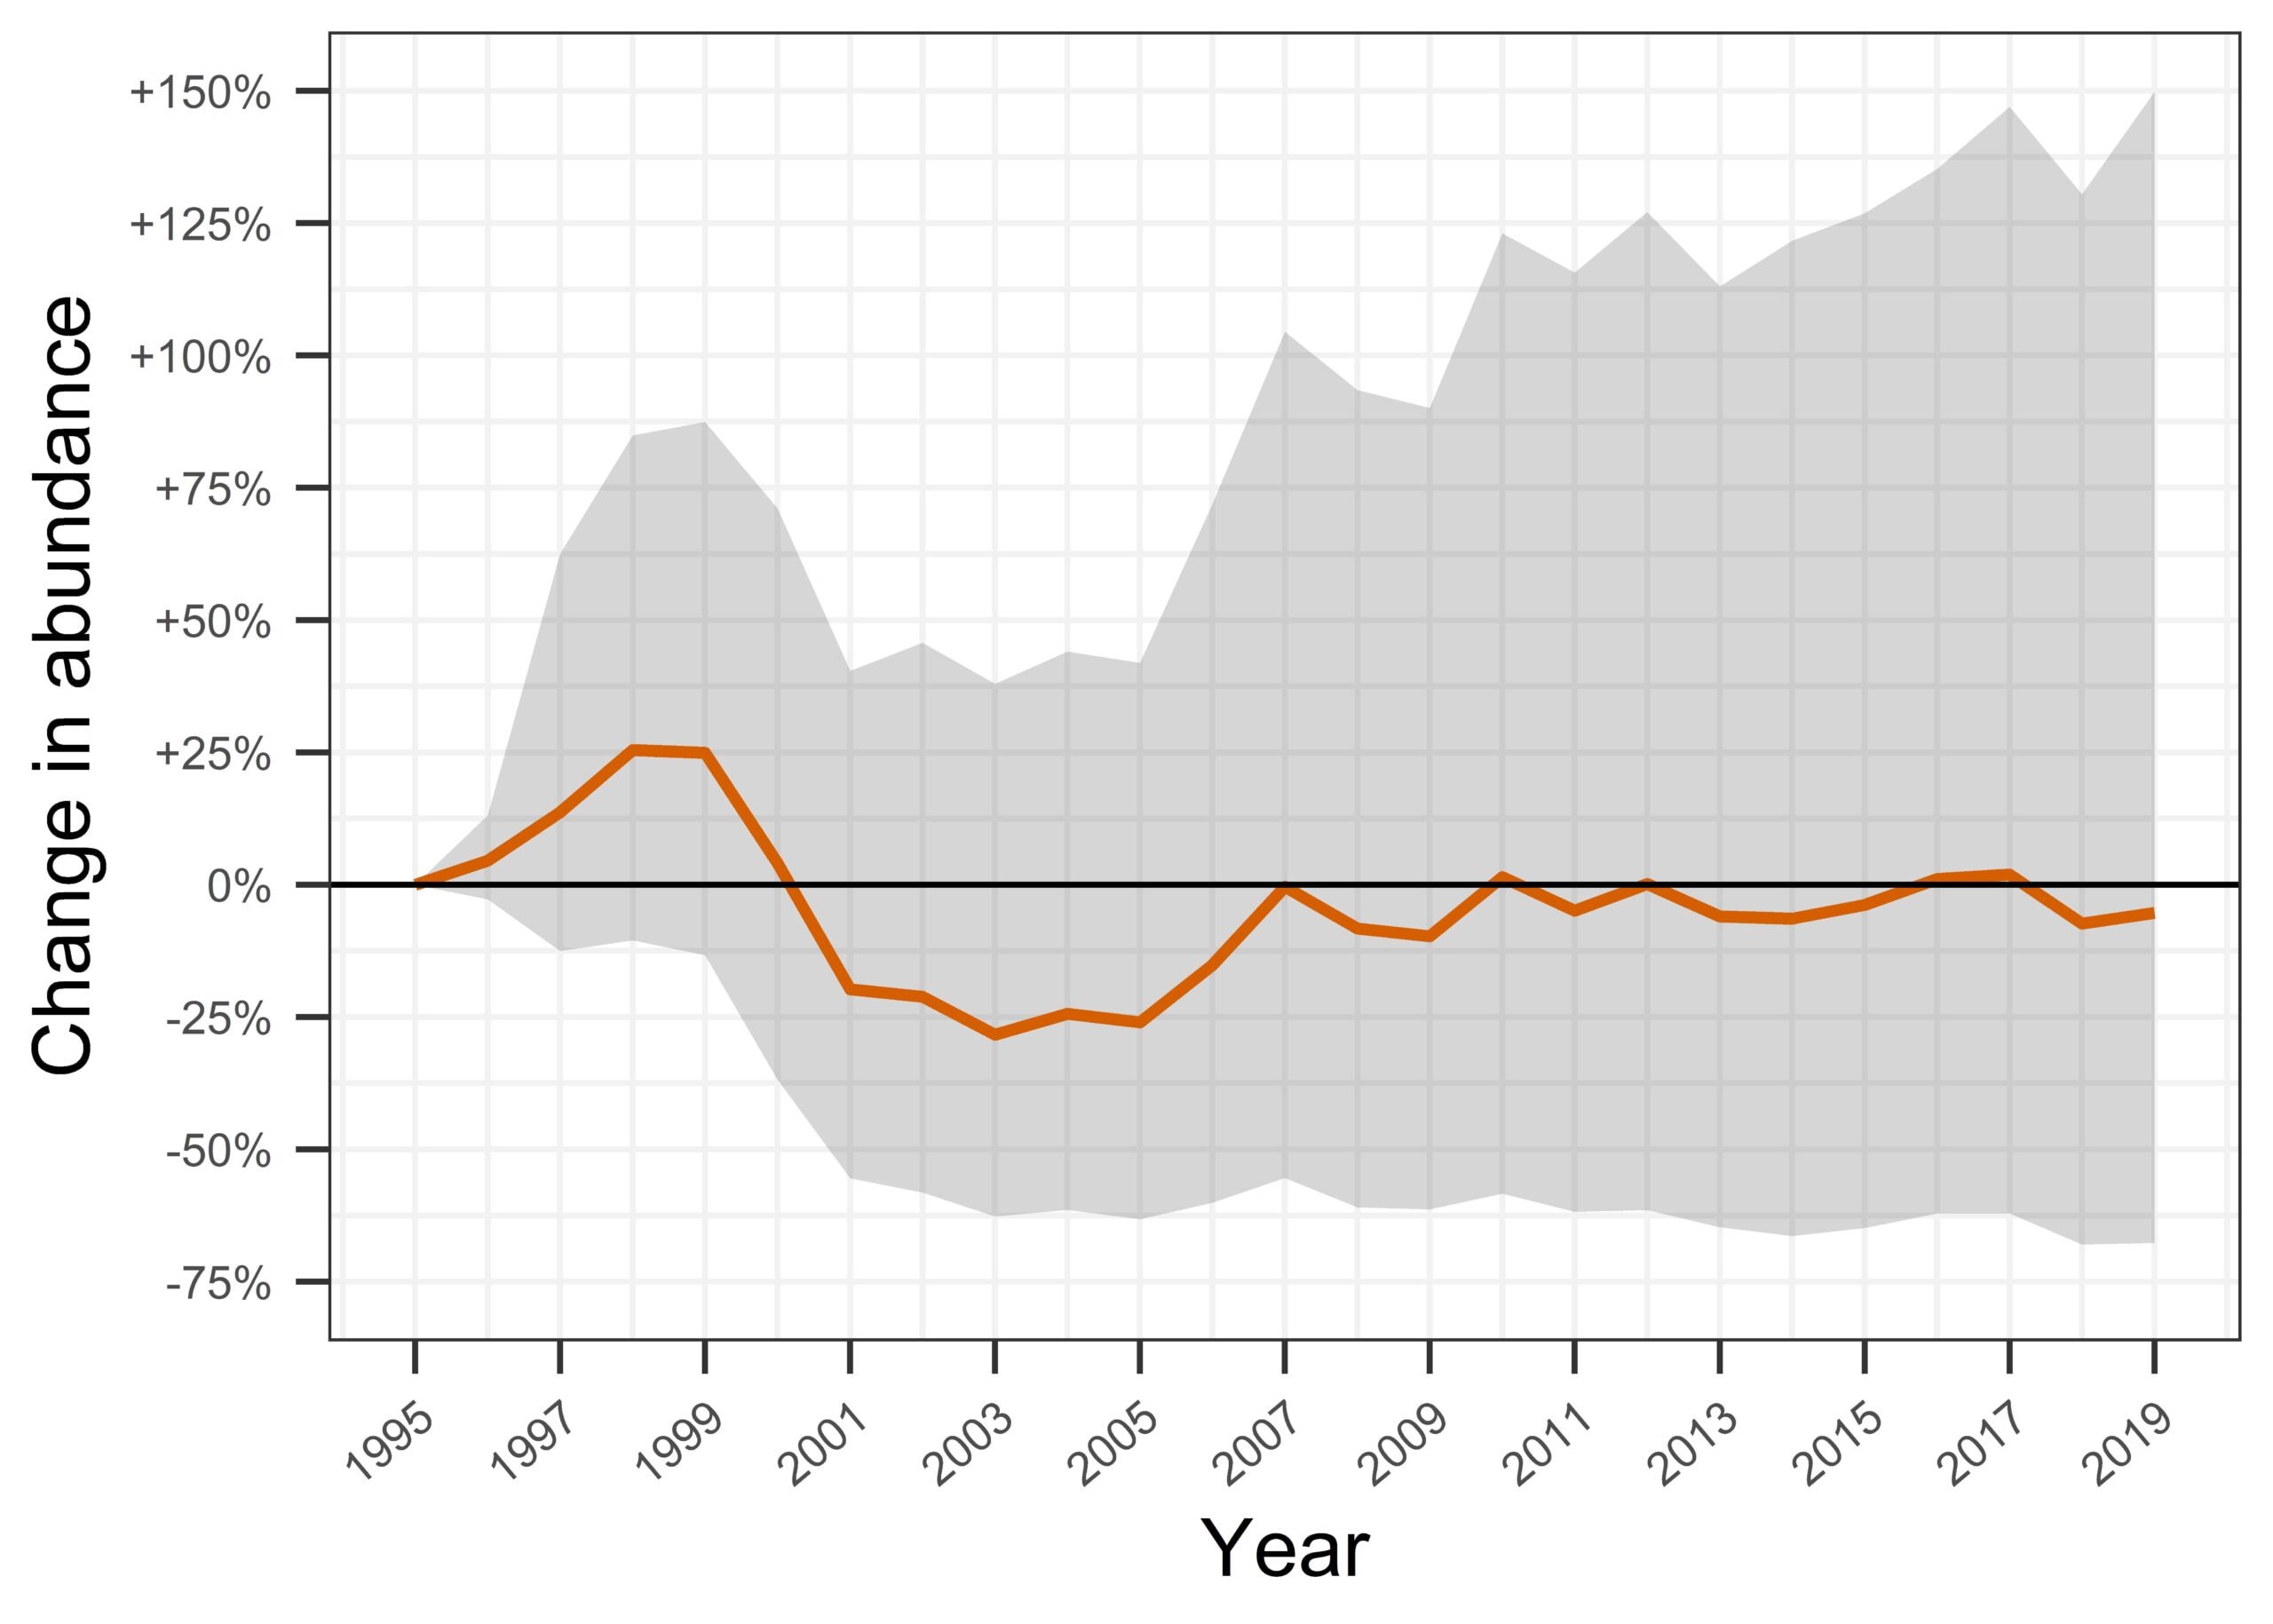
What of Australia’s national priority species? The TSX holds time-series data for 30 of the 110 national priority species under the Commonwealth’s Threatened Species Strategy, including 9 birds, 11 mammals and 10 plants (total time-series = 1,927). On average, the abundance of these species has declined by 77% since 1990. Declines were relatively steep after 1998, with some stabilisation since 2004 (Figure 2).
Figure 2. The trend for National Priority Species between 1990 and 2019. The grey shading is a 95% confidence interval.
The good news
Having now dealt with the uncomfortable news, let’s turn our attention to the good tidings flowing from the latest TSX release. The first is that the monitoring data included in the index continues to grow, thanks to the goodwill of ecologists, NGO’s, conservation managers, recovery teams and citizen scientists from across the county. The index now covers 278 species, with 24 new species added in 2022. What’s more, 625 new time-series were added for this release, taking the total tally to 19,893. While there are various gaps in the TSX dataset — taxonomic, spatial and temporal — the dataset continues to build, meaning our confidence in the resulting trends can too.
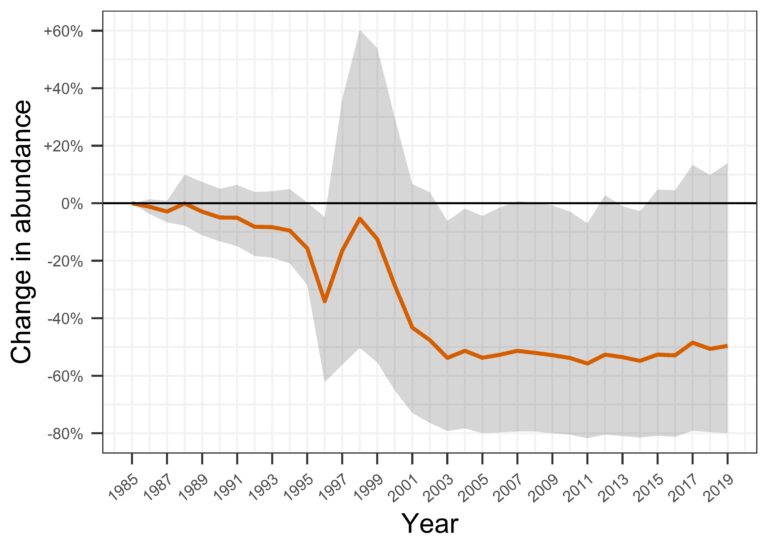
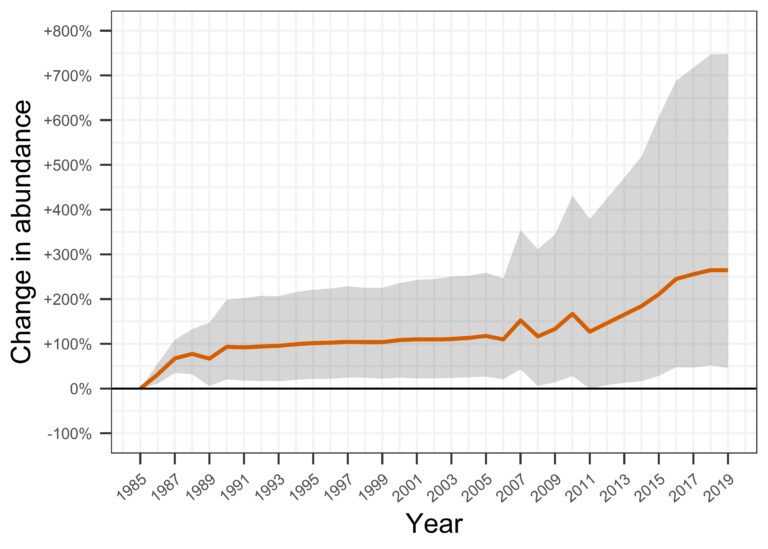
The second slice of good news is that some species and groups of species are stabilising, showing signs of recovery or increasing. For example, critical-weight range mammals (those with a body weight of between 50-5000g, which are particularly susceptible to feral predators) have stabilised, correlating with the significant investment in recovering these species (Figure 3). Likewise, essentially all the 13 large mammals for which the TSX has data are increasing in abundance (Figure 3).
Figure 3. Trends for critical weight range (top) and large mammals (bottom) between 1985 and 2019. The grey shading is the 95% confidence interval.
The third piece of good news is that management data which the TSX holds provide encouraging evidence that when we invest in conservation we can slow declines, and in some cases, achieve rapid recovery. Compare mammals at actively managed sites to those with no known management. At actively managed sites, mammals are stable on average (Figure 4), with some populations having significantly higher abundance than in 1995 (as indicated by the upper confidence limits on Figure 4). For plants, populations at actively managed sites have declined less and much more slowly than at sites with no known management (Figure 4).
Actively managed
No known management
Figure 4. Trends for mammals (top) and plants (bottom) between 1995 and 2019 at sites that are either actively managed or at which there is no known management. The grey shading is the 95% confidence interval.
Wandering Albatross
Over to you
As you can see, the TSX is much more than just an over-arching statistic on how our threatened and near-threatened species are tracking. It contains a wealth of information, of which we have given you just a snippet here. To investigate further, head to the TSX Visualiser Tool at www.tsx.org.au/tsx2022. You can discover trends for your favourite species group, examine how trends differ between different states and territories, and compare the trends with different baseline years (amongst numerous other ways you can cut the data).
We’ll leave you with just one request. If you have data that you think could be of use for the TSX, please reach out at tsx@tern.org.au. You can find out more about what kinds of data the TSX can accept here: www.tsx.org.au/growing-the-index/contributing-data/. We are always on the hunt for new data and the opportunity it provides to strengthen the index.
Reproduced with permission from the University of Queensland’s Centre for Biodiversity and Conservation Science (CBCS) Autumn 2023 newsletter.
