NCRIS-enabled projects AURIN and TERN are delivering data and analysis tools to support research and planning for more sustainable urban environments. Explore the free urban and environmental data and services that make informed planning and policy-making possible.
Discussions around suburban sprawl have made headlines in recent months as the reality of life at the fringes is revealed for new residents.
Many were attracted to new outer suburb developments, or exurbs, by the promise of the good life, a spacious home and a garden of their own in a healthy connected community – with an easy commute to the city, and all at a fraction of the price of inner-city suburbs. The reality now unfolding is long commutes, lack of public transport options, limited community facilities and cohesiveness and, more commonly, feelings of isolation.
Not only are these developments revealing that liveability is limited for the human residents, in many cases, they have also made these spaces unliveable for our native wildlife, compounding the negative impacts and transforming huge expanses of our countryside into developments that disconnect residents from the nature that surrounds them.
Access to nature is an intrinsic part of liveability. As housing developments encroach on valuable habitats of our flora and fauna we have an opportunity to adapt our development styles and better incorporate existing natural habitats into the design of our neighbourhoods says RMIT sustainability and urban planning expert Professor Sarah Bekessy:
“We don’t value habitat and vegetation appropriately, they are built over and offset to outer areas.
“This denies protection of our local species and access for our population to our natural heritage and the benefits nature can offer us.”
Prof Sarah Bekessy, RMIT
Prof Bekessy and her research group ICON Science implore planners and policy makers for a rethink of our style of development to take design aspects such as optimal density, variety of housing types, efficient use of space, accessibility to services and inclusion of access to nature, into consideration to improve livability while meeting the needs of our growing demand for housing.
So how do we create policies for housing and growth of urban and regional settlements and support planning of new housing developments, that address various socio-economic and demographic factors of the expected population, identify their infrastructure needs and protect our environment and the liveability of our neighbourhoods?
Accessing this type of information to make informed planning and policy decisions is possible thanks to the support of NCRIS-enabled national research facilities such as the Australian Urban Research Infrastructure Network (AURIN) and TERN’s network of terrestrial ecosystem mapping.
These two national research infrastructures provide access to data and analysis tools to support research across a broad range of disciplines related to urban and regional development.
They provide access to the evidence-base needed for informed, effective decision-making to shape the communities and environment we live in.
Urban data at your fingertips
AURIN provides a secure online workbench that allows all levels of academic and government researchers to access, analyse and visualise quality data on issues surrounding health and wellbeing, socio-economic metrics, transportation, and land-use. Researchers can analyse information about our communities and their neighbourhoods and inform planning and policy decisions when designing new developments.
AURIN works with data custodians such as the Australian Bureau of Statistics (ABS) to make data accessible to researchers from academia, government and industry. They recently released historical ABS Census data dating back to 1976. It is the first time that this span of data across time is being made freely available to researchers.
Australia’s largest, longest and most consistent data collection around who we are, and where we live, developed over the last 100+ years, includes information on health, education, labour force, migrants, crime, business, disabilities, ageing and carers. It is our greatest source of information to tell us who we are and where we are going.
Access to this data can allow researchers to explore how our communities and groups within the community have shifted and evolved over time. This can inform better planning and policy decisions to support future population. Data from large organisations such as the Australian Tax Office, HealthDirect Australia, and Australian Property Monitors can help inform decisions around service provision, helping planners leverage existing infrastructure assets and ensure future populations are adequately catered for.
Environmental data visualisation
TERN provides open access tools and services that allow Australia’s environmental monitoring data, collected by TERN and many others, to be explored and analysed by expert and non-expert users alike.
In addition to on-ground environmental monitoring and data collection in peri-urban landscapes, TERN and the Australian National University’s Centre for Water and Landscape Dynamics (ANU WALD) have created the TERN-ANU Landscape Data Visualiser.
This web atlas lets users discover a wealth of landscape and ecosystem data from satellite observations, airborne measurements, field surveys, sensor networks and national-scale model predictions.
The TERN-ANU Landscape Data Visualiser gives you access to more than 50 datasets providing information on, for example:
- Ecosystem composition
- Vegetation properties
- Carbon uptake and release
- Bushfires
- Water and energy exchanges
- Soil moisture
- Soil depth, texture and chemistry
- River flows and inundation
You can drill down to any location of interest, compare data and locations, and download any of the data shown. It also allows users to quickly view and manipulate the data without having to download them first, which saves valuable time and computing resources.
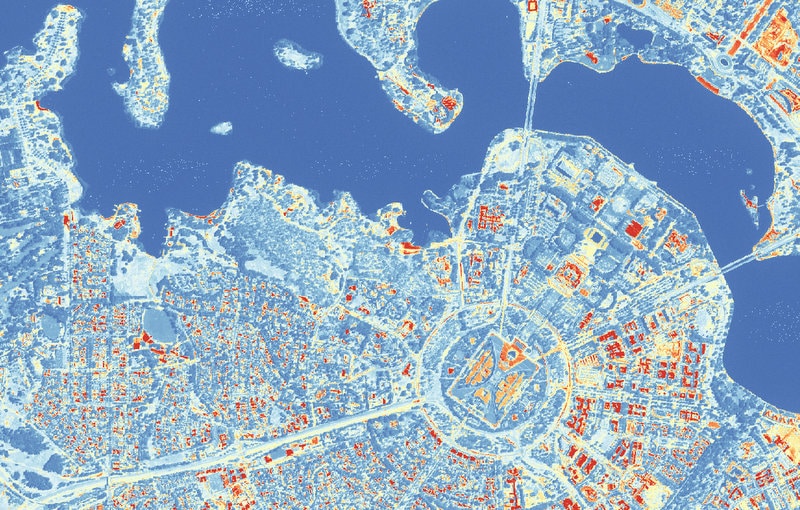
The Visualiser lets users compare satellite and model-derived data with measurements from TERN’s ecosystem observing field sites and with high-tech airborne laser scanning (LiDAR) and hyperspectral data products that TERN has developed for several intensive research locations in Australia, including the entire Australian Capital Territory (ACT).
Users can find airborne products relating to vegetation cover, height, structure, foliage chemistry and also digital elevation models, water body mapping and building footprints, to name a few.
Rapid urban development in western Sydney under the spotlight
One area of Australia that has experienced particularly significant urban growth is western Sydney’s Cumberland Plain—home to a critically endangered woodland ecosystem.
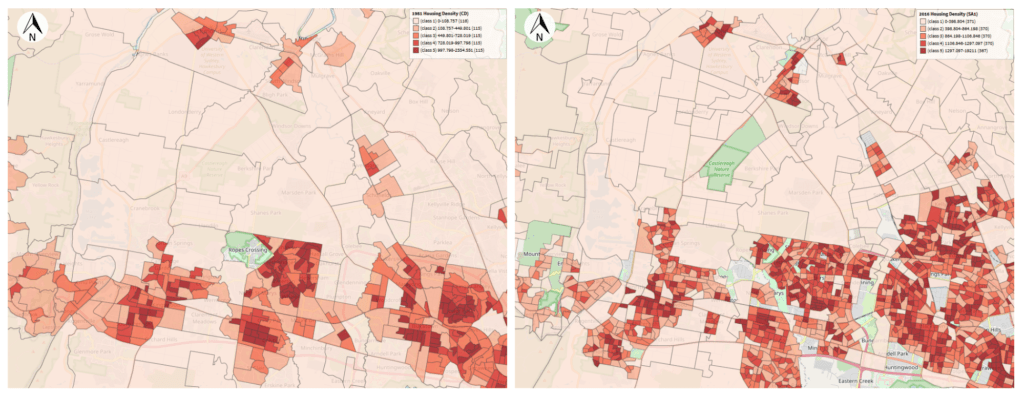
A quick analysis in the AURIN Portal of housing density over a 35 year span shows an increase in both already built-up areas, as well as new high-density developments in other areas.
For the past decade, research infrastructure at TERN’s Cumberland Plain SuperSite has been collecting data to track the impact of urban development on the region’s critically endangered woodland—and the impact of other major pressures including conversion to agriculture, invasive weeds and altered fire regimes.
These large amounts of environmental data are all openly-available via the TERN Data Discovery Portal and represent an immensely valuable time-series resource for researchers and urban planners alike.
For example, data from the site are facilitating research on the changes to the region’s sources and sinks of CO2, the impact of drought on our ecosystems, and the vulnerability of trees to hotter and drier future climates.
Additionally, wildlife monitoring using camera-traps and acoustic sensors provide valuable baseline data, allowing scientists to track changes to the region’s biodiversity over time.
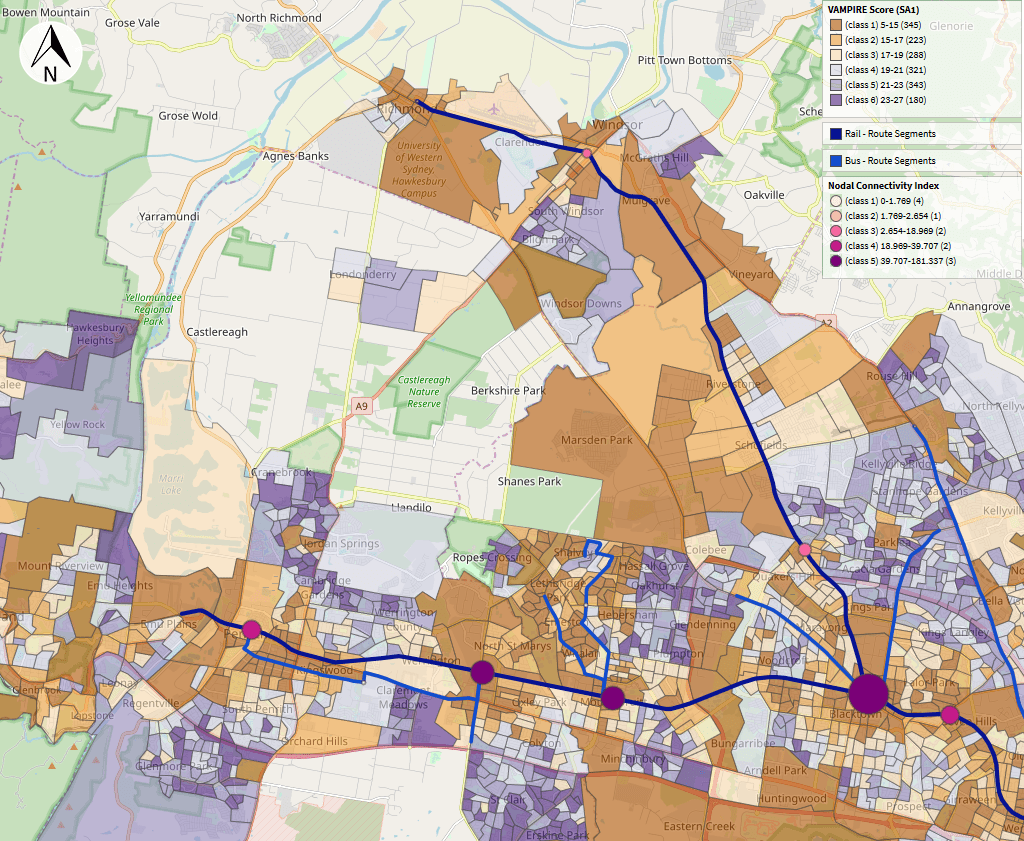
o further understand the impact of urbanisation in the region, and the potential risks, additional data accessed, analysed and visualised on the AURIN Workbench can give us a richer picture of what the lived experience might be for residents.
Data from the Spatial Network Analysis for Multimodal Urban Transport Systems (SNAMUTS) system, measuring the performance of a region’s current public transport network framed around the accessibility of the transport network and accessibility of place, and index data from research institutions such as the Vulnerability Indices for Mortgage, Petroleum and Inflation Risks and Expenditure (VAMPIRE) from Griffith University’s Urban Research Program can be used to analyse public transport connectivity as well as vulnerability to financial stress from changes in petrol prices.
These two federally funded eResearch facilities are empowering researchers, planners and policy makers with highly valuable and otherwise inaccessible data and analysis tools needed across the environmental and urban development fields.
The cross-disciplinary nature of these facilities ensures that planning and policy decisions can be more informed to improve the liveability for our human populations without compromising native fauna and flora.
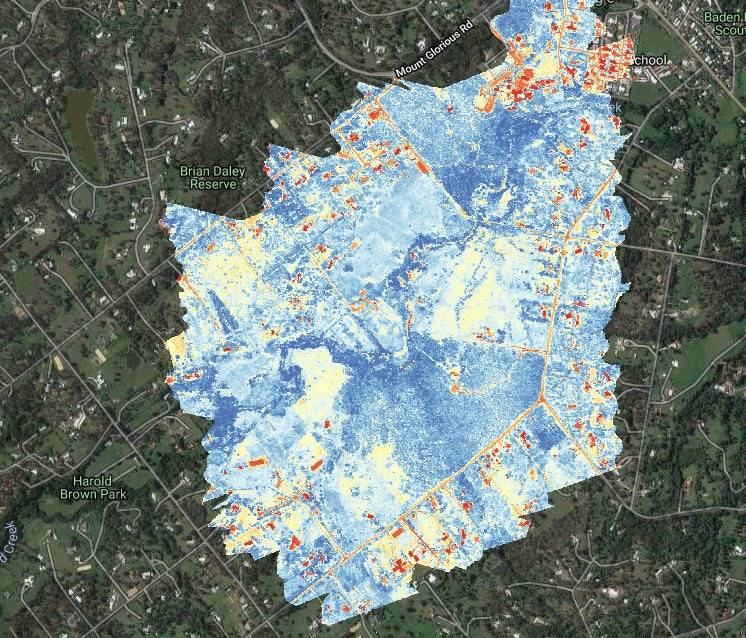
- TERN’s Cumberland Plain and Samford Peri-Urban SuperSites are two of TERN's highly instrumented field sites that monitor Australia's ecosystem processes at a high level of detail. Data from all TERN monitoring sites are openly available via the TERN Data Discovery Portal.
- Access to more than 50 datasets for online visualisation is available via the TERN-ANU Landscape Data Visualiser.
- Learn more about AURIN here.