After eight consecutive years of reporting on the trajectory of the nation’s natural resources and ecosystems, we reflect on the aims and achievements of Australia’s Environment report and data explorer. We also compare it to what other countries are doing and share some future ideas for the product.
Since 2015 the Australian National University (ANU), with the support of TERN since 2019, has been taking the pulse of the continent and releasing annual summaries of key environmental indicators and how they’re changing.
The product, Australia’s Environment, allows patterns of some key drivers of change in Australia’s ecosystems to be assessed, which is critical to understanding and managing our environment.
The core of the annual report is a model-data assimilation system that integrates a wide range of satellite and ground station observations. Data downloads are possible via the explorer and report cards can be downloaded for any administrative or geographic region of Australia, including local government areas, electorates and bioregions, for example.
How does it compare to others?
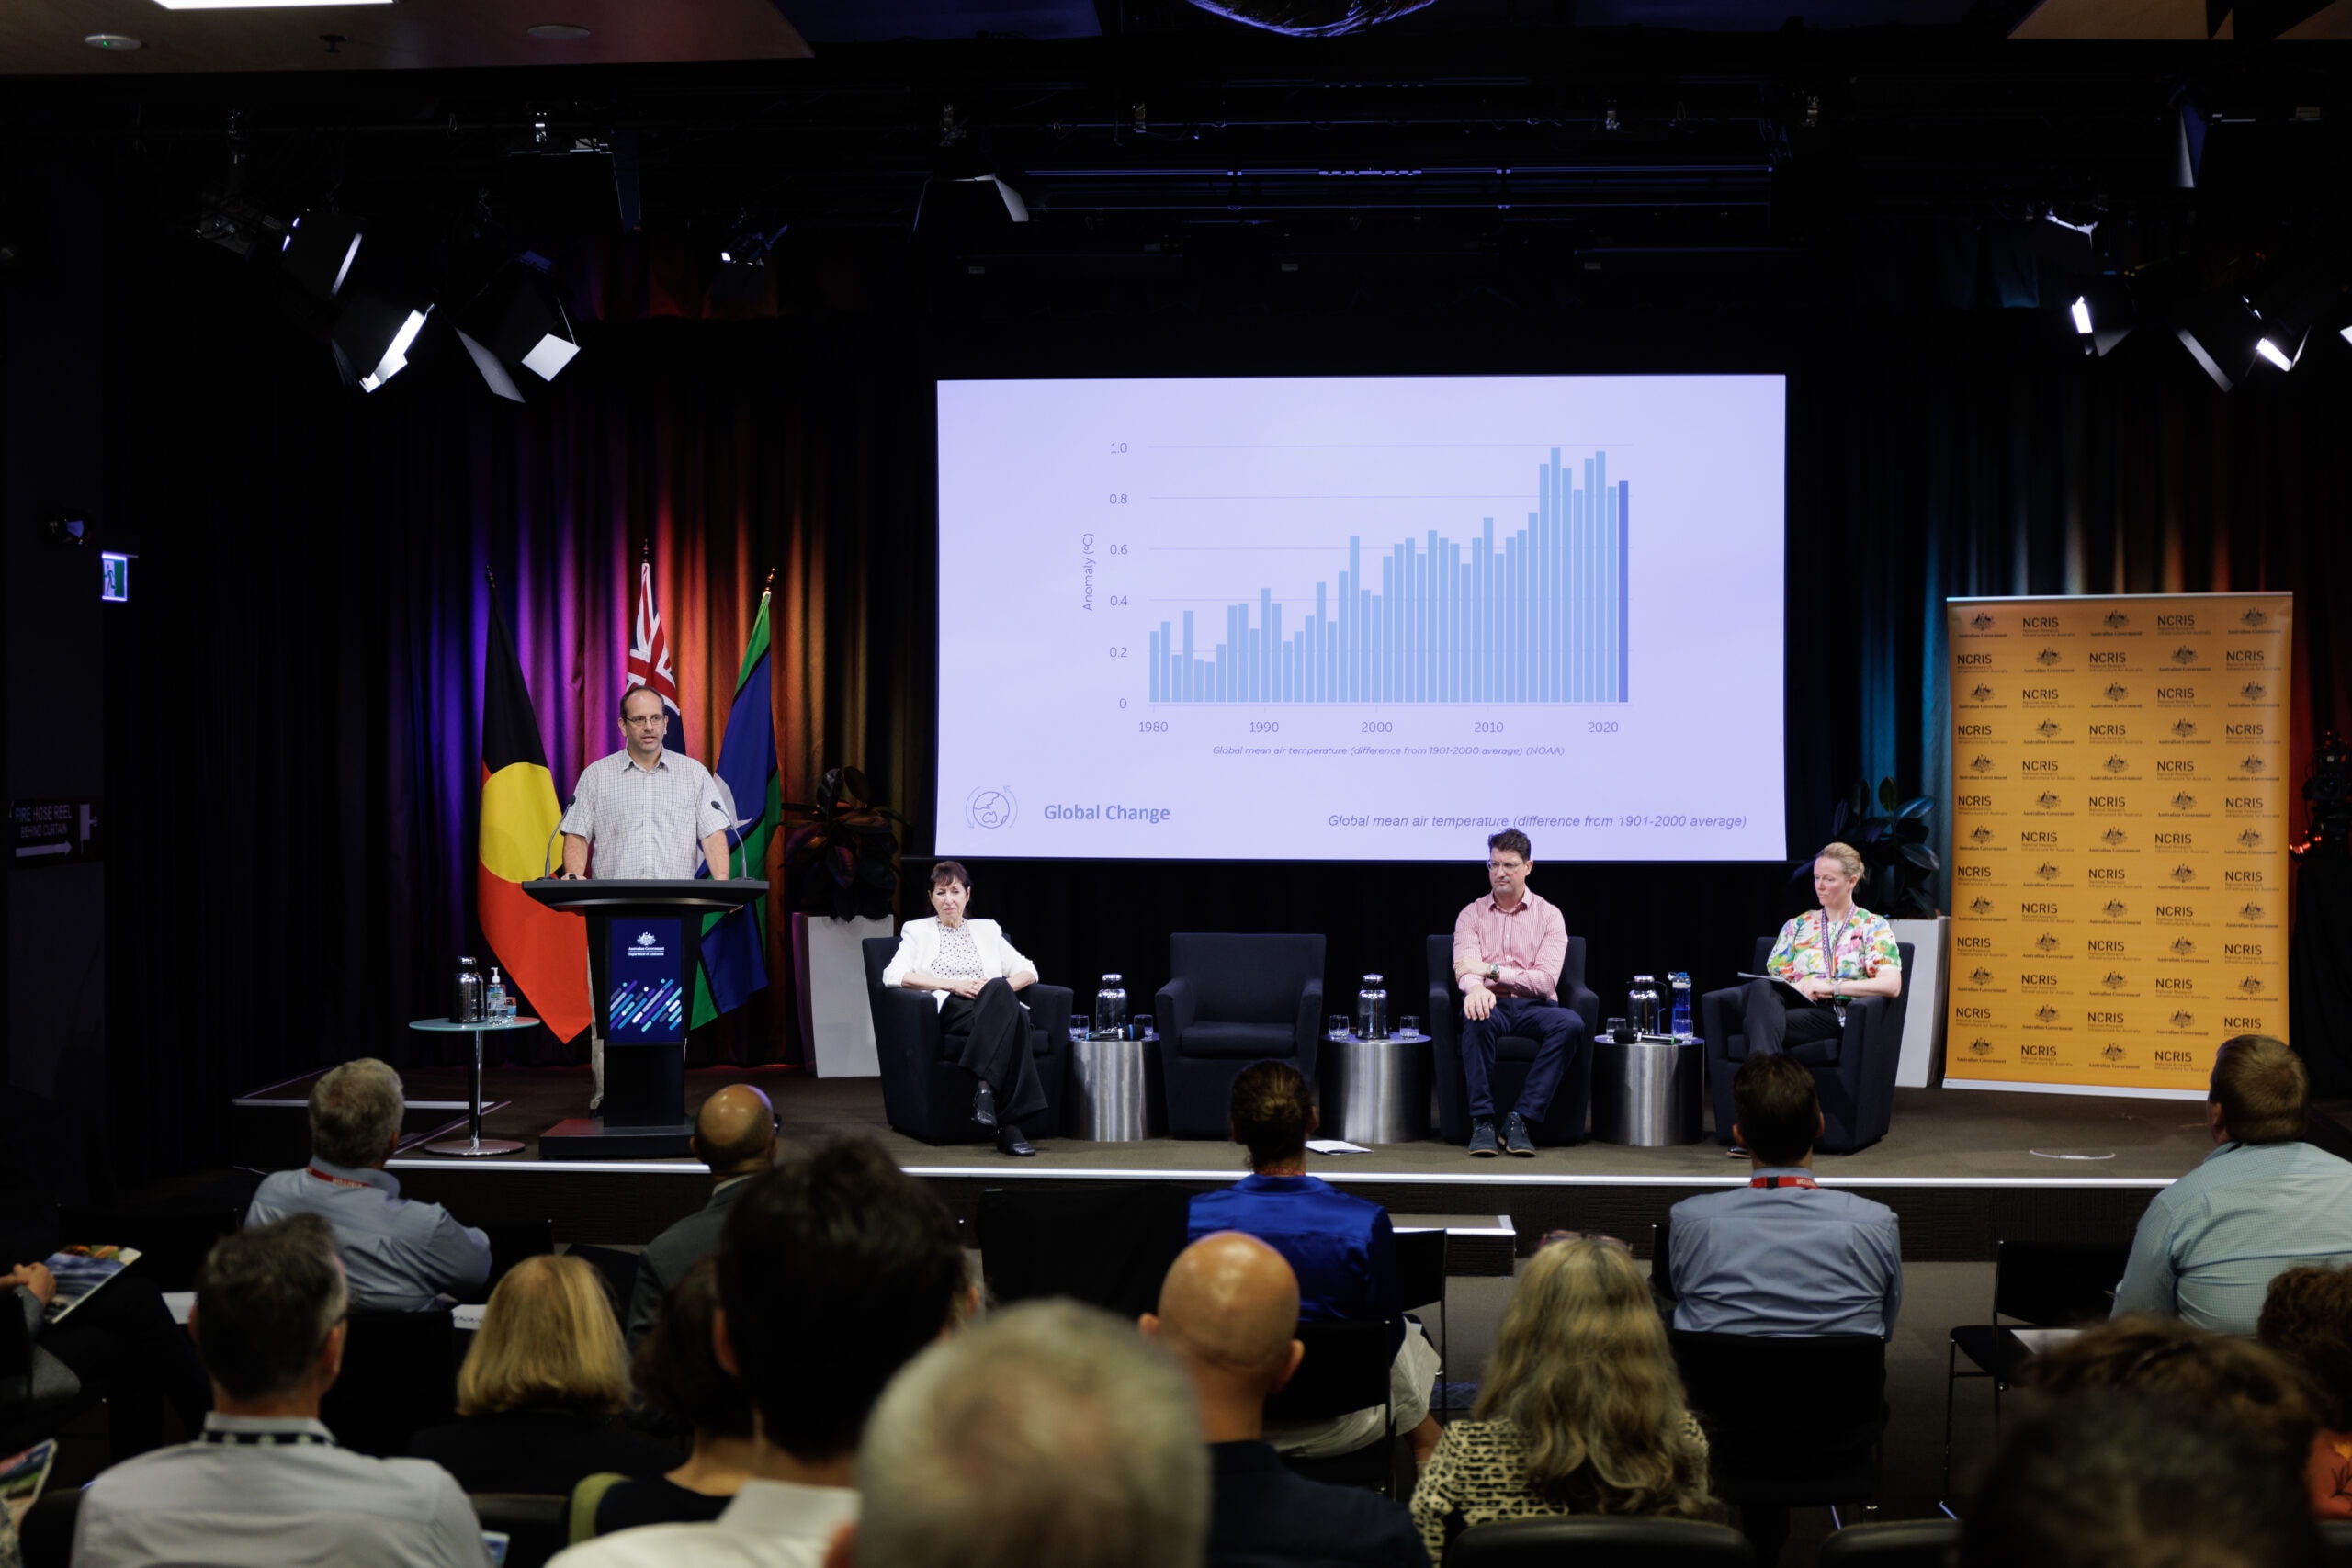
At the March 2023 launch of Australia’s Environment report for 2022 in Canberra, an audience member asked about similar reports in Australia and internationally and how our effort compares. It is a great question and worth having a look at.
Every five years, the Australian government publishes the State of the Environment report, while Australia’s States and Territories also release similar reports every few years. A common characteristic of these reports is that they use the OECD’s ‘pressure–state–response’ (PSR) framework, which uses expert analysis to connect the causes, effects and policies around environmental issues.
Internationally, other OECD countries produce similarly framed State of Environment (SoE) reports, produced by a government department, an Environmental Protection Agency or other independent authority or agency. As the environmental issues and underlying processes do not change rapidly, the reports are usually not produced annually.
Australia’s Environment is different from SoE reports and yet highly complementary. It is annual, not related to any legislative mandates, and it provides consistently assessed metrics and related information in between successive SoE reports. Although not interpreted within the same framework, the spatial and temporal data reported on mostly relate directly to environmental pressures or states, making it a valuable input for SoE reports. The report does not venture into assessing or recommending government policies but provides public information to enable anyone to do so.
A somewhat different approach to environmental condition reporting is the System of Environmental-Economic Accounting (SEEA), which provides a statistical summary of natural resources and environmental condition and services, and, as much as possible, links these to economic data. The Australian Bureau of Statistics produces such reports, as does its equivalent in Canada, for example. In fact, Australia’s Environment was originally conceived to provide the biophysical inputs for environmental-economic accounting and is still highly suited. Data by statistical area can readily be visualised and downloaded. Its structured, fully-national and consistently formatted data makes it an ideal data source for environmental or economic research.

Another point of distinction is that Australia’s Environment focuses on fully spatial data that can be interpreted at any level, from local to national. In Australia’s sparsely measured landscape that also means estimation of missing data, often with the aid of satellite Earth observations. For the same reason, the report has less emphasis on issues for which detailed national data are lacking, such as for example air, soil and water pollution.
Internationally, the Report on the Environment published by the US Environmental Protection Agency perhaps comes closest to our TERN-ANU product. Both are updated frequently and offer spatial and time series data visualisation and data downloads. What makes Australia’s Environment truly unique, is the ease with which data can be visualised, compared and downloaded as data files, graphs or scorecards at a range of spatial levels – from national level right down to, for example, individual catchments, local government areas and national parks. Already, many local natural resource managers use the data as part of their reporting and monitoring programme.
So far, we have identified country-level reporting on key environmental parameters is also carried out in US, UK, NZ, Japan, Germany, EU, and Canada. Let us know if you are aware of other countries we should add to the list.
While comparison is important to understand global standards and it’s nice to know we’re in good company in what we’re doing, Australia does need its own product. Given the unique characters of Australia’s landscape, biodiversity and geographical location, Australia needs an environmental reporting product (or multiple products) that suits its own requirements and facilitates useful application from a wide user group across education, planning, industry, policy and management sectors.
What it is, what it isn’t and what’s next?
The Australia’s Environment reporting project was started to address the challenge that spatial environmental monitoring data exist but finding and understanding them is not easy and working with them is even harder. You often need specialists to find, summarise and interpret the data for you, but that can take years, and by then the information may be irrelevant, says lead author of Australia’s Environment, professor Albert Van Dijk.
“Australia’s Environment doesn’t try to be everything to everyone. We want to demonstrate which environmental data are already being collected and can be usefully synthesised, interpreted and reported on annually. And we want to do that in a way that is intuitive, easily-accessible and useful to a wider range of people than existing environmental accounts are.”
“Australia’s Environment is all about clear, concise annual data and analysis on environmental condition status and trends to help everyone from school children and teachers to researchers, natural resource managers and policy-makers monitor and analyse trends in the years between government State of the Environment report releases.”
Professor Albert Van Dijk, Australian National University
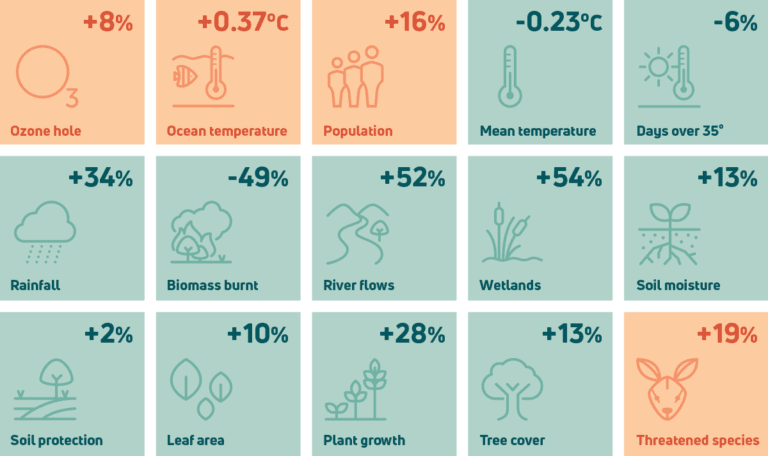
Australia’s Environment reports on a commendable 15 key environmental indicators but the TERN ANU partnership is working hard to add more. This year, for the 2022 report, data from the TERN-managed Threatened Species Index (TSX) were incorporated for the first time. Although TSX data are collected by a different methodology to that used for the other 15 parameters, including the TSX data provides a significant boost to the report’s data-driven biodiversity information.
Over the coming years we aim to add additional nationwide data on the processes that can contribute to declines in environmental condition, such as invasive species and native vegetation change. We look forward to working with our partners and community to achieve this.