TERN is developing an innovative approach to integrate plot-based ecological data collected by TERN and multiple agencies from different jurisdictions. This is your chance to review the progress of this landmark initiative and provide feedback.
Plot-based monitoring is used to survey soil properties, vegetation, animal populations and ecosystem processes by using repeatable methods and procedures. Recurring measurements of the same observed properties enable scientist to study the long-term impact of on-going environmental and resource management practices. However, even if the measurement is one-off, the observations will add to an inventory for flora and fauna species and ecological processes at a site.
A large amount of plot-based ecological data is collected around Australia by multiple agencies across jurisdictions. For example, every state and territory collects and publishes plot-based vegetation and ecological data to meet the legislative requirements, including reporting under the Environmental Protection and Biodiversity Conservation (EPBC) Act and the State of the Environment (SoE) every five years.
Data are often collected using varying survey methods and procedures, even though the observed properties are similar. And, typically, use of these data for analysis is confined to the jurisdiction from where the data was collected.
Integration for analysis and synthesis
The value of plot-based datasets increases once they are integrated with data from other similar projects or programs at a larger scale. However, until now, there has been no agreed-upon approach or national data infrastructure established for the integration of plot-based ecological data to enable unified search and access.
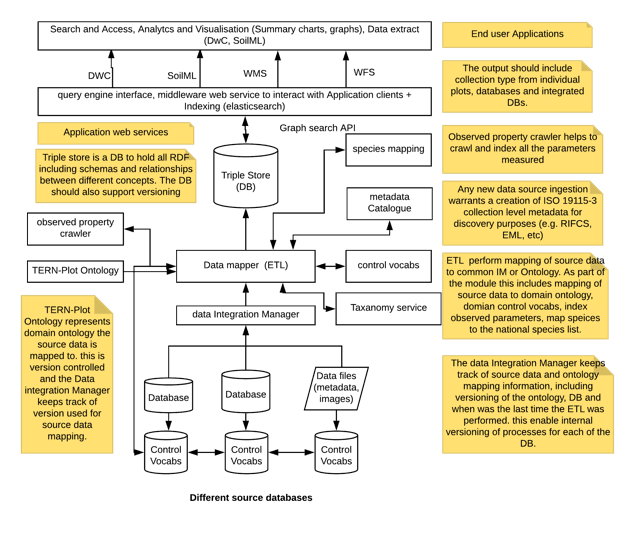
A collaborative team from TERN and CSIRO is developing a ‘Semantic Web’ solution that integrates data from different projects/programs, jurisdictions, observational themes, observable properties, survey methods, temporal scales, and taxonomies. The proposed data integration solution uses a hybrid approach where domain-related terms in each of the data sources are mapped to a shared ontology and data source-centric terminologies and methodologies are built as controlled vocabularies using the Simple Knowledge Organization System (SKOS).
The TERN-Plot ontology and controlled vocabularies
The TERN-Plot ontology is derived from the Observations and Measurements (O&M) and the Semantic Sensor Network (SSN) ontology. The core structure of the TERN-Plot ontology consists of classes and properties to describe plots, sampling activities that happen within a plot, and an observation or collection of observations which have procedures to produce results.
The TERN-Plot ontology uses O&M to capture the observation elements; and eight new classes to describe the ecology-plot domain. The ontology supports linkages between a feature of interest to observations. All of the scientific details, and most of the bio-physical descriptions are captured as the results of observations on the features. Each observation relates to one observable property. The set of Observable Properties is maintained as a controlled vocabulary. This complements the feature-based domain model to complete the TERN-Plot ontology.
A small number of controlled vocabularies are required to provide values for properties in the TERN-Plot ontology. Eventually, these will be managed as a whole-of-project set of vocabularies and applied to the data from all data providers. Vocabularies are defined for each data provider, except for universal terms like unit of measure, place, jurisdictions, etc.
A prototype and your input required
The implementation of the TERN-Plot platform is in progress using the Queensland Government CORVEG data. CORVEG is a database containing vegetation and social observations, which has been mapped to the new information model with the implementation details and all the corresponding control vocabularies.
The development team from TERN’s Data Services and Analytics platform is now focusing on testing the prototype using more databases and improving the automation of the systems. The team is also working on a flexible interactive dashboard that enables users to easily query and access any observations with all contextual information provided.
Details about the implementation will be presented as a poster in the upcoming International Semantic Web Conference (ISWC 2019) and the information model was presented this month at the ILTER Open Science Meeting 2019 in Germany. The presentation received lot of feedback, including the suggestion to add further categories of data based on themes like native vs introduced flora and fauna. Such information is generally not included by data providers with the consequence that categories have not previously been created by TERN.
This is why we are keen to receive feedback from the user community about its need for TERN to map data to different categories and traits. We would also like to hear community feedback and views about plot ontology and how we can also improve further in this area.
- For more information on this project or to provide feedback, please contact TERN’s Data Services and Analytics platform lead, Dr Siddeswara Guru via tern@uq.edu.au or on +61 (0)7 3365 9097.
Guru: example of data flowfor #vegetation height @TERN_Aus @NCRISimpact @ecoEd_ @adaptive_plant @AarontheEcolog https://t.co/Cf1BDPrzyN
— Glenda Wardle (@desert_ecology) September 3, 2019