Creative desktop methods for plot-based monitoring of Australia’s ecosystems—the next best thing to fieldwork in a time when fieldwork is not the best thing.
Having started the year with the establishment of 15 new permanent monitoring plots in Tasmania’s Ben Lomond and Central Highlands bioregions, TERN’s Environmental Monitoring Systems had upwards of 16 weeks of field monitoring planned for 2020.
Initial targets centred on the creation of new 1-hectare monitoring plots in South Australia, the Northern Territory, Queensland and Victoria, as well as a combination of new plots, transects and site revisits in Western Australia, adding important temporal scale to our surveillance monitoring data. Plans were also made to survey fire impacted plots to collect data and samples on ecosystem recovery.
However, due to COVID-19 restrictions, the field monitoring component of TERN was promptly put on hold. Field monitoring in the traditional sense, that is.
Enter digital innovations to traditional methods
In true innovative TERN spirit, we quickly looked to digital desktop solutions that would enable us to continue monitoring and delivering open data on changes in the environment.
Through partnership with the Food and Agriculture Organisation of the United Nations (FAO), the team has begun integrating traditional field-collected data with the visual assessment of recent and historical earth observation images using Open Foris’ Collect Earth software.
The Collect Earth tool enables land use and vegetation assessment through freely available, very high-resolution satellite imagery, using the interface of Google Earth, and access to 40 years of satellite data through Google Earth Engine. It is allowing TERN to remotely collect information on major disturbance, such as from fire and flood, and changes in vegetation cover.
With fieldwork on hold, we've been using some exciting desktop methods for monitoring 🇦🇺's ecosystems. 🛰️🌿
— TERN (@TERN_Aus) July 7, 2020
Pretty exciting to spot the TERN cars in this historic satellite imagery from Qld's gulf plains! 😁
More in our next eNews. Subscribe: https://t.co/dd376rho61#NCRISimpact pic.twitter.com/LDR3ur3jva
“The researcher can ‘fly’ to the sites, all thanks to high-resolution satellite imagery. Once at a ‘site’, the researcher can then move back through the time-series satellite image archive to assess the date-stamped current estimate of cover—a measure of the rapidity of change occurring—if and when there is any evidence of fire in the image archive, and visually assess fire severity.
The researcher can also link to TERN field-collected data to quantify the accuracy of the visual interpretation of images method and what and when other major disturbance has occurred at TERN’s plots.”
Dr Beryl Morris, TERN Director
Fire history data from >750 TERN plots
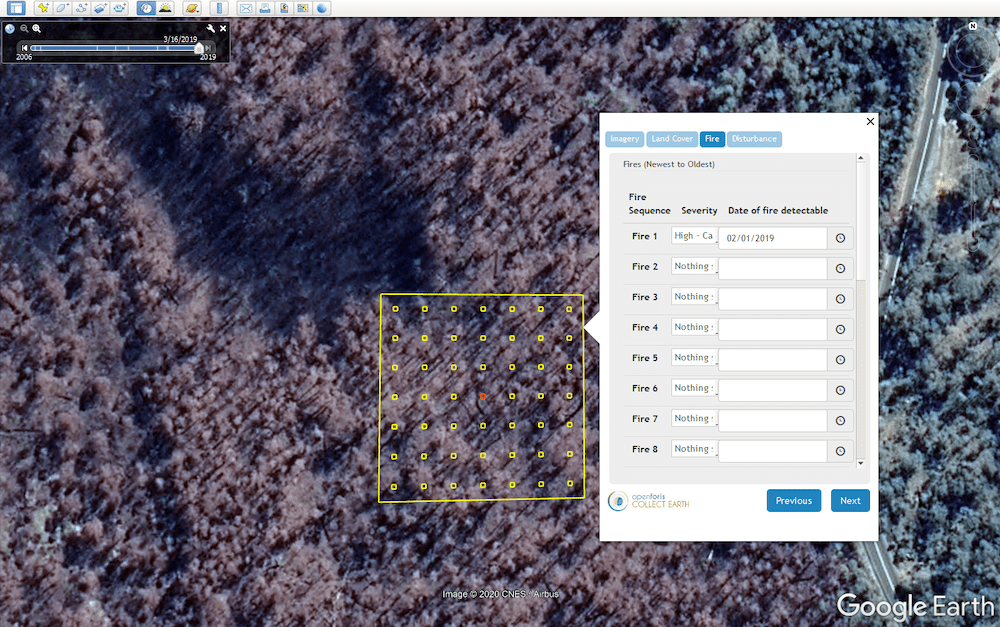
Using a multi-evidence-based approach consisting of historical aerial images, Sentinel-2, Landsat 7/8 and MODIS spectral imagery, as well as Normalised Difference Visualisation Index (NDVI) graphs, TERN’s Ecosystem Surveillance team has been recording fire history across the national network of TERN sites, including the determination of fire severity based on level of canopy burnt.
Using the imagery available in Google Earth and Bing Maps, vegetation cover and disturbance over time are also being assessed based on abundance of trees versus shrubs, grass, and bare ground or other.
The work is set to provide a really valuable add-on to our field-collected datasets. In addition to tracking fire or drought recovery over time, the information provides an extra filtering tool to researchers and land managers looking to use TERN data and samples.
It will also be a valuable supplement to our site selection process for new TERN plots and site revisits.
The process is not without its challenges, though. The Australian landscape, vegetation type and growth form, as well as soil colour, potentially present some difficulties due to their effect on the spectral images. However, the multiple sources of evidence enable the team to effectively overcome these challenges and continue TERN’s critical data collection and environmental monitoring.
Collaborating with FAO on ecosystem monitoring since 2016
The Collect Earth software was developed by the FAO six years ago, with funding from Germany’s International Climate Initiative, to enable developing nations to report under climate conventions.
In its six years, the tool has been used by 30 developing nations, the FAO’s Global Drylands Assessment, and by many other researchers, says Alfonso Sanchez-Paus Diaz of the FAO and Collect Earth product manager.
“The spirit of Collect Earth is to simplify land monitoring by providing a tool easy to use yet with state-of-the-art technology, which we have achieved by integrating it with Google Earth, Google Earth Engine and other sources of imagery and remote sensing.
Seeing our tool being adopted by countries all over the world and by institutions like TERN, is a sign that we are working in the right way. We are really happy to be collaborating with TERN since 2016 with the Global Dryland Assessment and now with the assessment of TERN sites. We hope that this collaboration will continue in the future”.
Alfonso Sanchez-Paus Diaz, FAO
With restrictions lifting and travel becoming possible at least within most states, the members of the TERN field team shouldn’t have to wait long for a return to some field monitoring. In fact, earlier this month, the team was at Brookfield Conservation Park in South Australia (a short trip from its University of Adelaide home) resurveying permanent TERN plots and conducting training and method calibration.
But until we can travel to all our far-flung sites, the tools made available by the FAO and Open Foris are allowing the next best thing to fieldwork in a time when fieldwork is not the best thing.
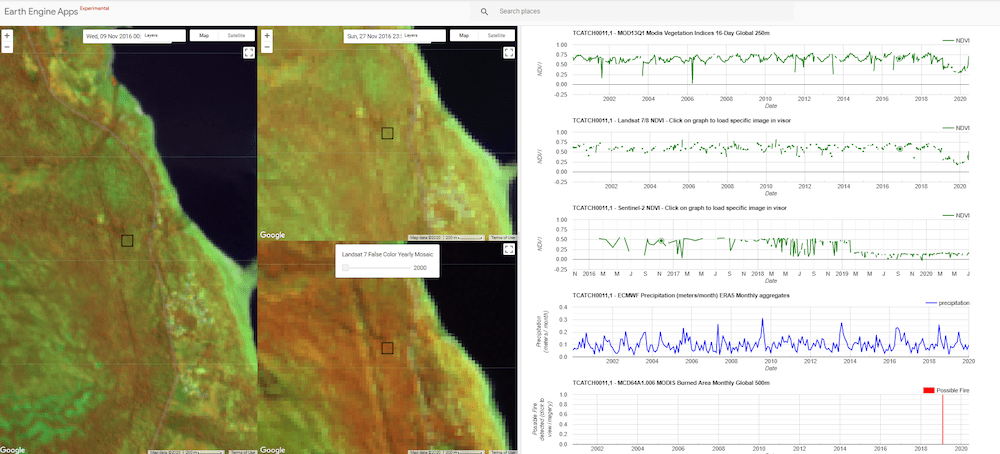
November 2016 - before fire
TERN Ecosystem Surveillance plot no.11, Central Highlands, Tasmania (TCATCH0011)
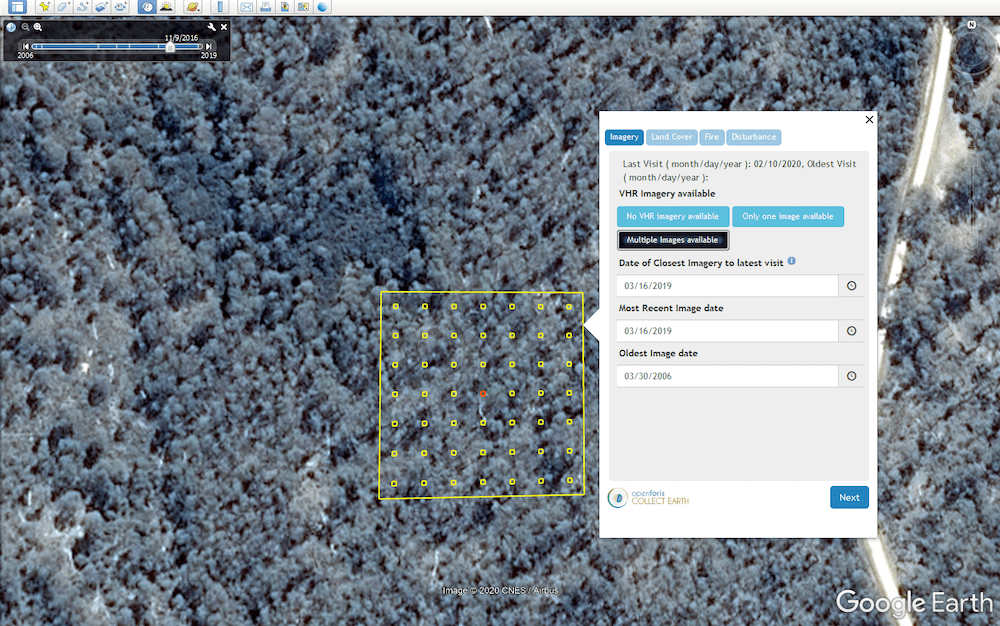
Examples of the Collect Earth user experience in Google Earth Pro (above) and Google Earth Engine (below). The Collect Earth tool enables data collection using very high resolution satellite imagery, while Google Earth Engine provides access to spectral imagery where red = vegetation, green = lack of vegetation, and black = water. (Credit: Google Earth)
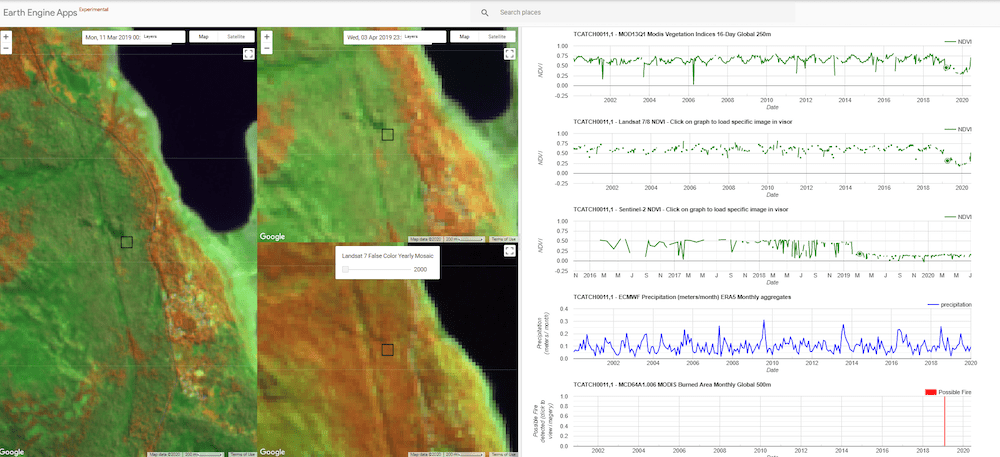
March 2019 - after fire
TERN Ecosystem Surveillance plot no.11, Central Highlands, Tasmania (TCATCH0011)
Impact from fire in February 2019 is clearly evident in the satellite imagery (above). In the spectral imagery (below), fire impact is indicated by less red and more green colours (below left) and by drops in key vegetation indices (measures of greenness) in the accompanying graphs (below right). (Credit: Google Earth)