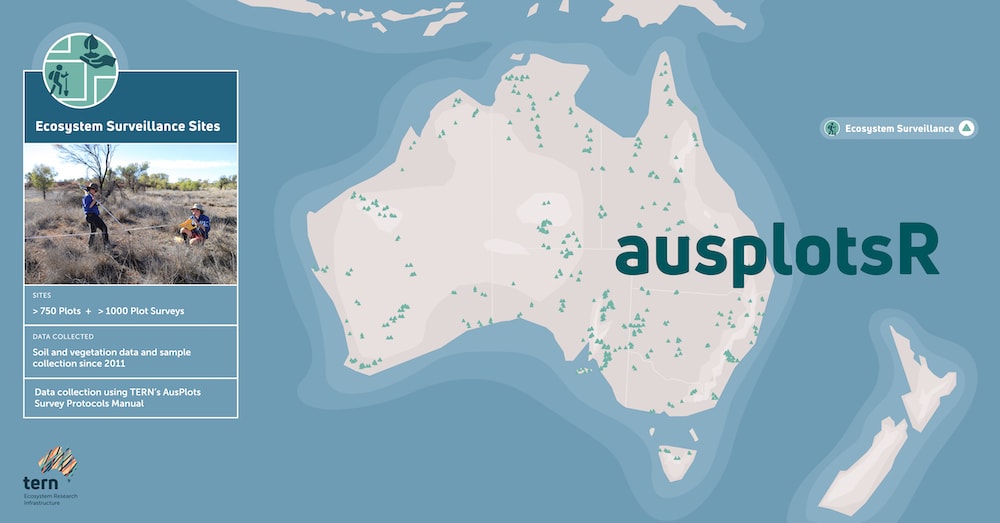
Need to quickly map sites and graph things like fractional vegetation cover or relative cover of plant growth forms for multiple plots? These are all possible with the new and updated version of TERN’s ausplotsR package, which also provides free and instant access to a decade of soil and vegetation data collected at over 780 environmental monitoring sites across Australia.
TERN is proud to announce the Comprehensive R Archive Network (CRAN) has approved and published the new ausplotsR. CRAN is the primary global repository for R packages where you can easily find R source code, manuals, and tutorials.
CRAN approval gives users of ausplotsR confidence that the package has been through a thorough review process, is authentic, simple to discover, and easy to install directly within a standard R session. The latest development version and news updates can still be found on TERN’s Github page.
Direct access to TERN data
TERN’s ausplotsR package provides direct access to all of the data modules collected by TERN’s Ecosystem Observation platform (excluding photos) using the AusPlots Rangelands Survey Protocols Manual.
This includes measurements of vascular plant species presence, growth form, height, and cover, which are useful for predictive modelling and validation of remote sensing applications. Soil characteristics such as texture, pH, EC and bulk density are also available, and users can search for information on physical soil and plant samples.
These data are valuable for researchers because TERN field sites are found in some of the most remote and difficult to access areas of the country, helping to save scientists time and expense. The plots cover diverse climates and environments and provide a comprehensive snapshot of the state of vegetation and soils across Australia.
New and improved features
Researchers familiar with the first (2018) version of ausplotsR will note a few major improvements to the new 2020 ausplotsR. Firstly, the species identification data are now more globally compatible and simpler to sort. The scientific names of all plant species are mapped to a global nomenclature standard. This means it is now much easier to merge ausplotsR data with other global databases and to search, filter, and categorise by taxonomic fields including family, genus and species.
A second new feature is enhanced visualisation of the TERN data. The upgraded package allows users to easily and quickly map the sites and graph things like fractional vegetation cover or relative cover of plant growth forms for multiple plots.
A third new feature is a function that allows users to rapidly optimise site selection by comparing biodiversity between plots. The users can select an assortment of popular biodiversity metrics and indices to identify plots with greater numbers of species or unique plant communities, and to select a subset of plots to maximise species turnover and representation. The function also includes the option of visually comparing the optimisation using all of the biodiversity metrics.
“This new function in the ausplotsR package can be used with TERN data or any other vegetation dataset. It is an efficient tool that simplifies biodiversity analyses considerably. It can be implemented for reserve design in conservation biology studies or to compare different aspects of biodiversity in large datasets.”
Dr Irene Martín-Forés, University of Adelaide and TERN
“We have updated the ausplotsR package to make it as simple as possible for users to not only extract raw data, but also explore and understand what we have to offer. Whether you need plots in a certain location, dominated by a particular growth form, or containing specific species, ausplotsR will let you see what data are available.
We have also upgraded existing functions that perform the most common calculations researchers need to get started with their analysis, such as basal area or fractional cover. In no time at all, you can have standardised, reliable field data to examine any number of geographical trends.”
Dr Samantha Munroe, University of Adelaide and TERN
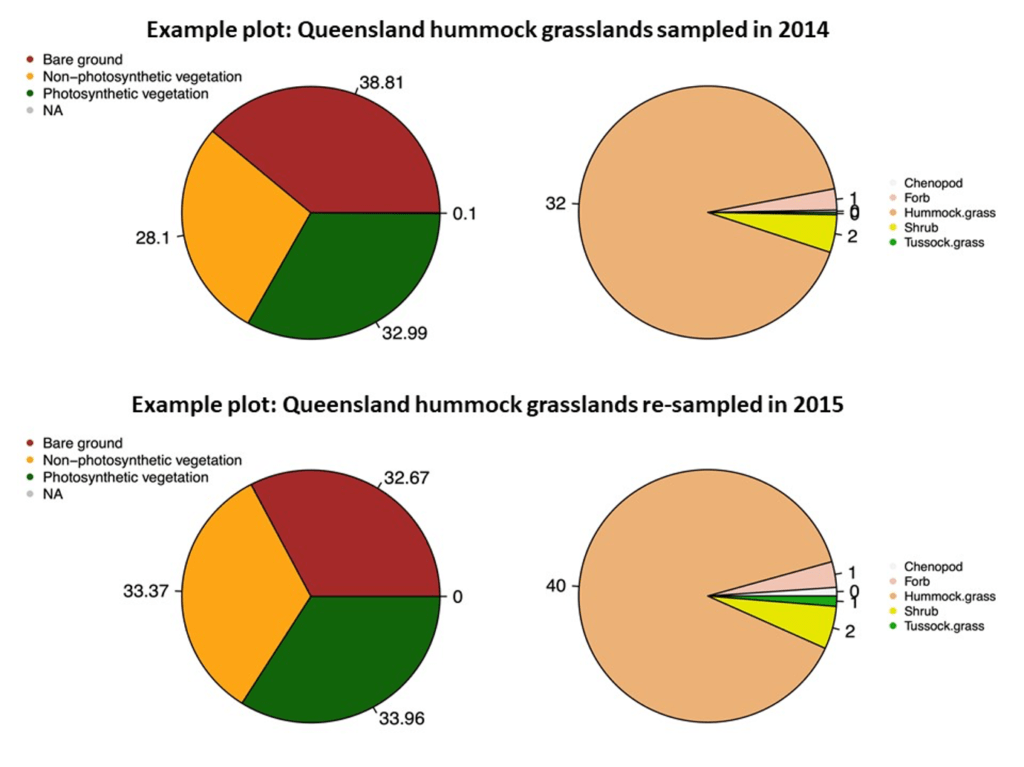
The upgraded ausplotsR package allows users to easily and quickly map the sites and graph things like fractional vegetation cover or relative cover of plant growth forms for multiple plots, as shown in the example above comparing two visits to the same plot.
Next steps and future improvements
The ausplotsR package will continue to evolve to enrich and simplify data interpretation. Some of the next big steps will be designing tools that allow researchers to more easily search across the vast TERN field sample library, and that will link AusPlots data with information on biological invasions, functional traits, and declared listings and regulations.
We look forward to seeing the creative, inspiring and game-changing ways researchers embrace the opportunities presented by this vast repository of standardised, freely available data.
2026 update – ausplotsR is managed by Dr Irene Martin-Fores, TERN Ecosystem Surveillance at Adelaide University. Please contact us for further information.