| SuperSite Equipment | Alice_Mulga | Boyagin Wandoo Woodland | Calperum Mallee | Cumberland Plain Woodland | Daintree Rainforest | Daintree Discovery Centre | Fletcherview Tropical Rangeland | Gin Gin Banksia Woodland | Great Western Woodlands | Litchfield Savanna | Mitchell Grass Rangeland | Robson Creek Rainforest | Samford Peri-urban | Tumbarumba Wet Eucalypt | Warra Tall Eucalypt | Whroo Dry Eucalypt | Wombat Stringybark Eucalypt |
|---|---|---|---|---|---|---|---|---|---|---|---|---|---|---|---|---|---|
|
Eddy-covariance flux towers |
13.7m & 10m |
2 x 4m | 20m | 30m | – | 35m | Portable tower | 15m | 35m | 35m | 2m | 40m | 2m | 70m | 80m | 36m | 30m |
| 1 ha Surveillance monitoring plots | 6 | 6 | 18 | – | 1 | 1 | 1 | 1 | 1 | 1 | 1 | 1 | |||||
| Phenocams | |||||||||||||||||
| Airborne LiDAR and hyperspectral imagery calibration | |||||||||||||||||
| Soil water content, temperature and electrical conductivity probes, soil water potential | |||||||||||||||||
| Meteorological station | |||||||||||||||||
| Acoustic sensors | |||||||||||||||||
| Cosmoz | |||||||||||||||||
| Groundwater bores with nested piezometers | |||||||||||||||||
| Sap flow system | |||||||||||||||||
| Free Air CO2 Enrichment (FACE) experiment | |||||||||||||||||
| Fuel moisture sensors | |||||||||||||||||
| Coupled sapflow sensors and dendrometers | |||||||||||||||||
| Camera traps | |||||||||||||||||
| Nutrient Network Plots | |||||||||||||||||
| DroughtNet shelters | |||||||||||||||||
| Gauging station to measure discharge | |||||||||||||||||
| Logging dendrometer bands/ dendrometers | |||||||||||||||||
| Rainout shelter | |||||||||||||||||
| Herbarium and insect collections for identifications | |||||||||||||||||
| Sapflux sensors | |||||||||||||||||
| Biodiversity plots | |||||||||||||||||
| Nutrient Network Plots | 40 | ||||||||||||||||
| 25 ha forest dynamics plot | |||||||||||||||||
| Greenhouse gas monitoring chambers | |||||||||||||||||
| Water quality sensors | |||||||||||||||||
| Continuous forest inventory plots | |||||||||||||||||
| Silvicultural Systems Trial plots | |||||||||||||||||
| Wildfire chronosequence plots | |||||||||||||||||
| Southern Forests Experimental Forest Landscape (SFEFL) plots | |||||||||||||||||
| Baseline Altitudinal Monitoring plots (BAMPs) | |||||||||||||||||
| Leaf Litter Traps |

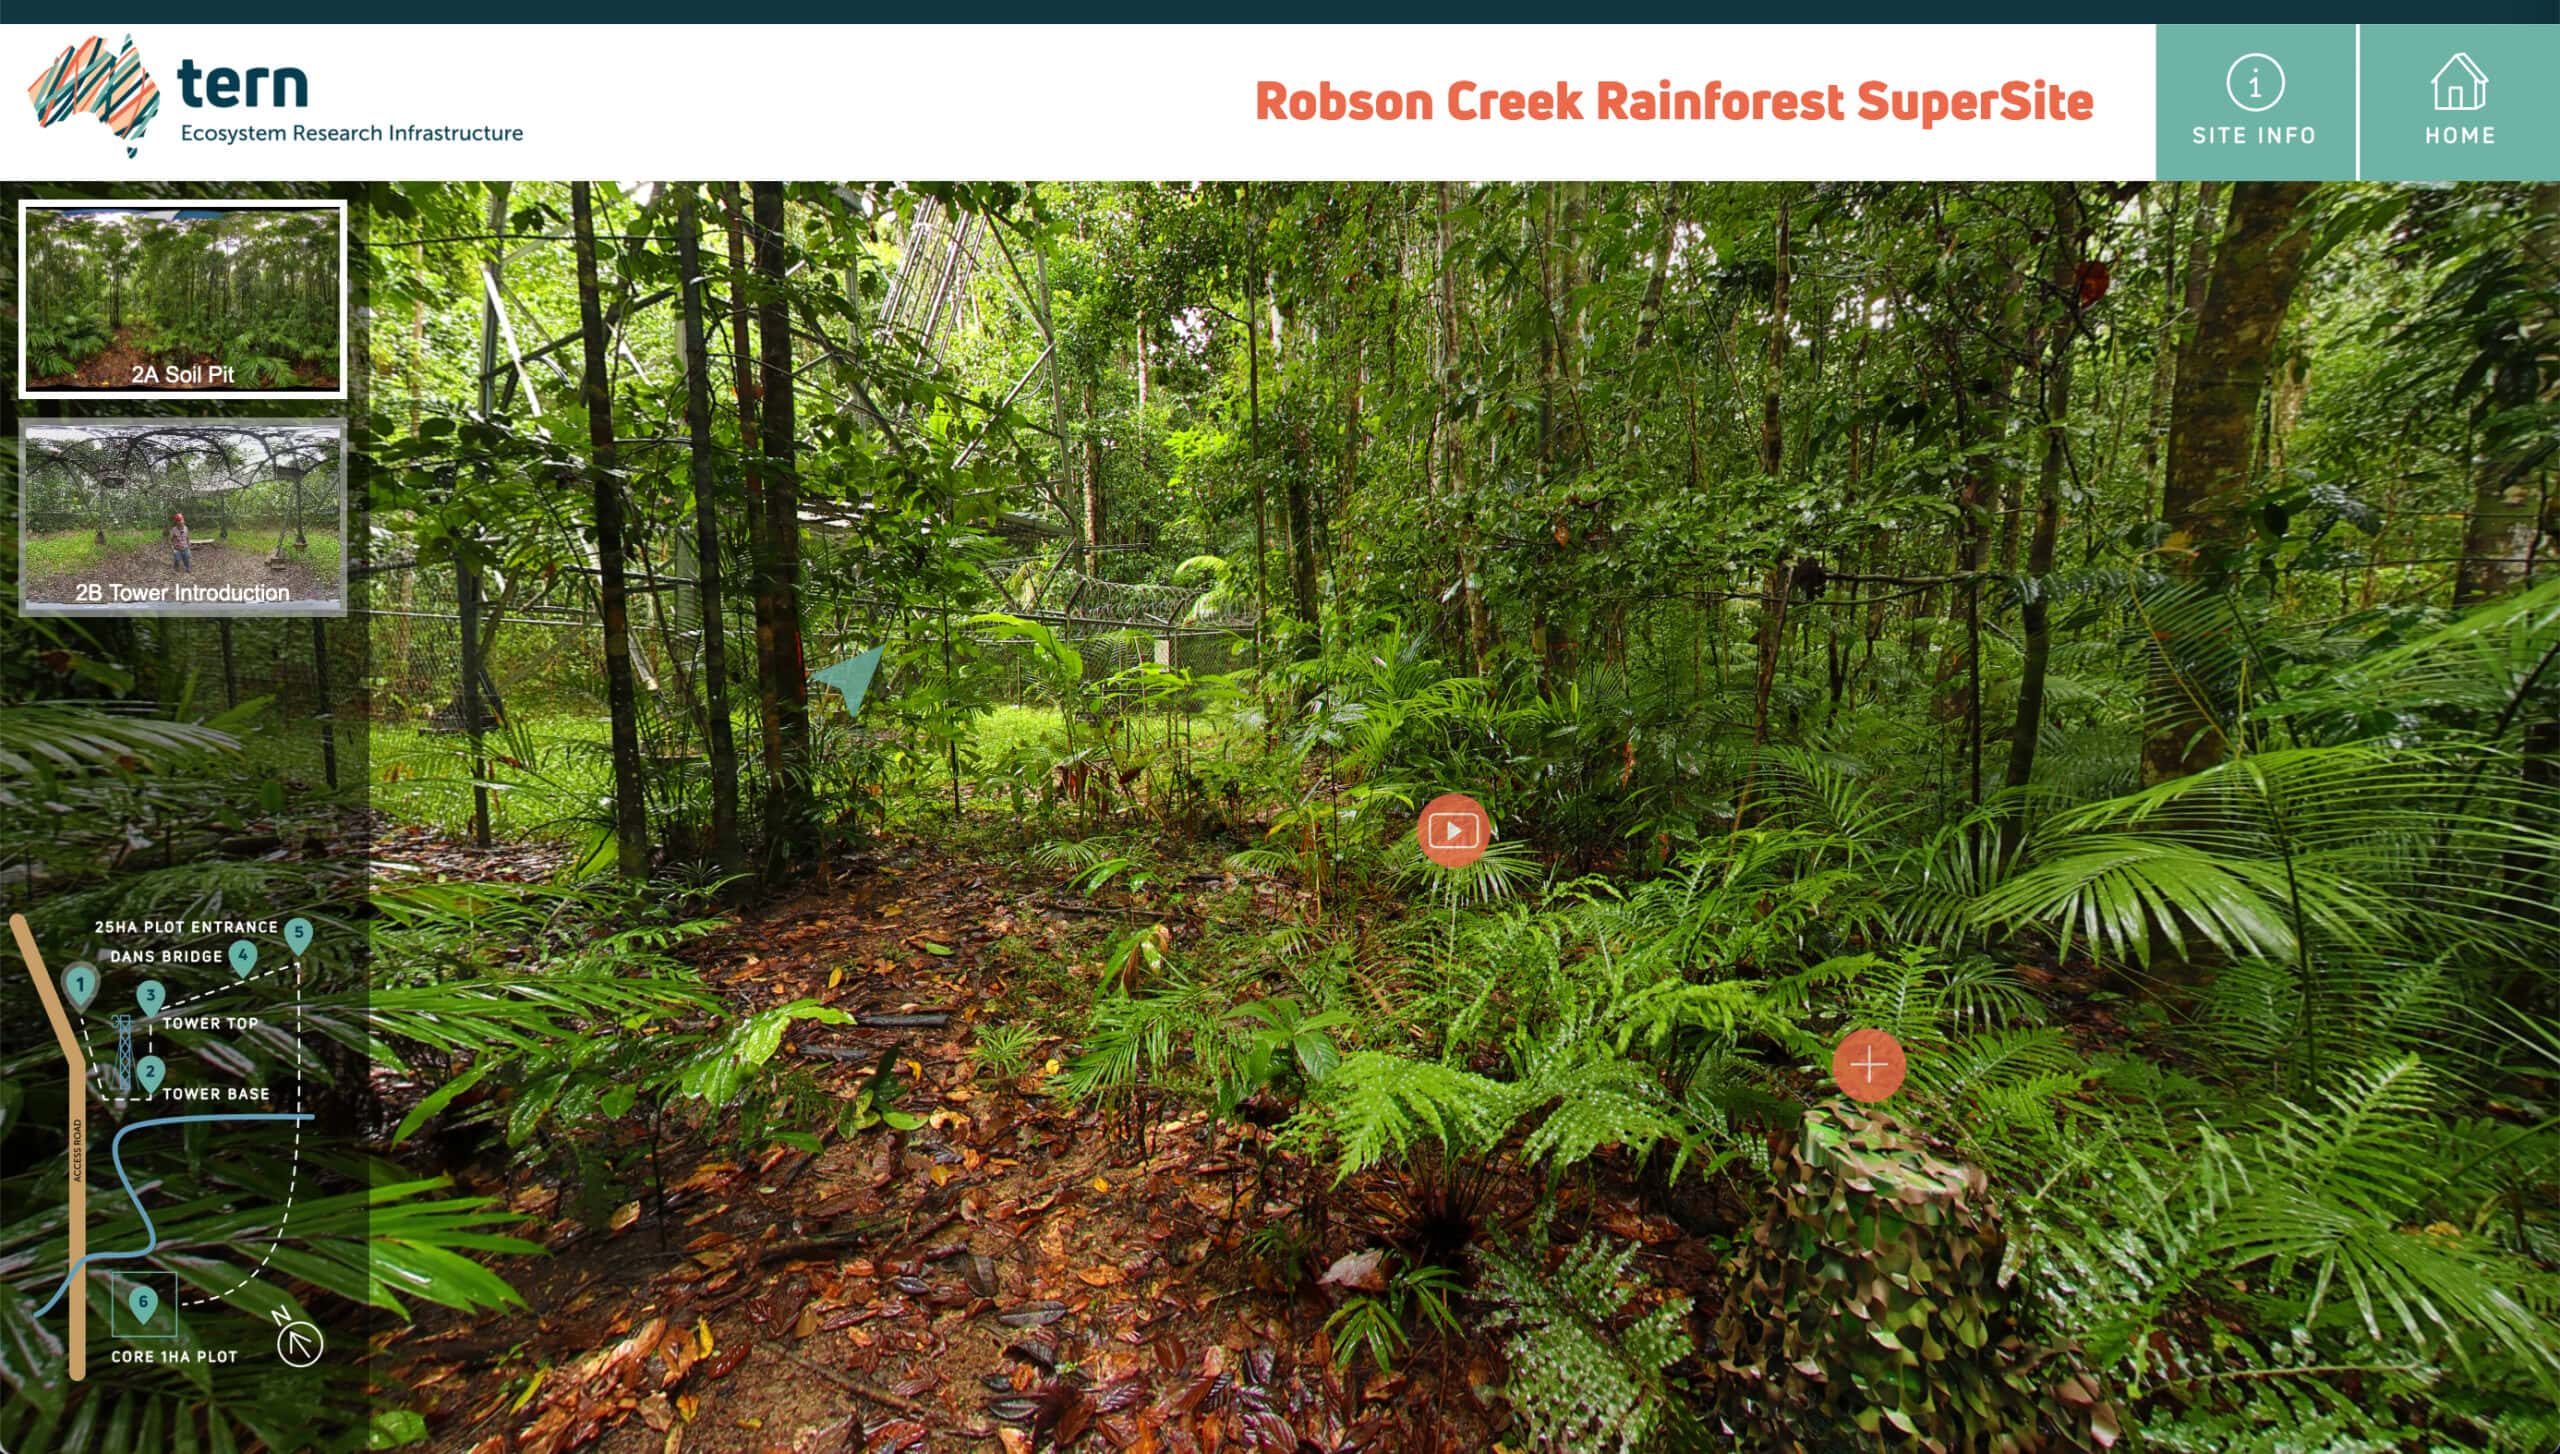
Welcome to the Robson Creek Virtual tour how to guide. When you arrive look up and down and move around 360 degrees. You might find hidden markers in the trees or on the forest floor. You can also zoom in and out if your mouse is able.
1 of 7Click on orange dots which show points of interest. A pop will appear with more information, photos and links about monitoring equipment and the natural environment in this ecosystem.
2 of 7Click to play videos
3 of 7Green arrows can be used to navigate to the next site on the map
4 of 7Each location has a few scenes you can explore. Click on the thumbnail you want to view and when you are done exploring this location use the map to move to the next location.
5 of 7You can also move through the tour by clicking on locations on the map
6 of 7Home will take you back to the start of the tour (Site 1)
7 of 7


