News

NSW water authority uses TERN data to track property water use

Aerial land map of rural Ausatralia.
TERN data have been allowing the New South Wales (NSW) water authority to track water usage at a property scale across very large areas. TERN’s world-leading, Australia-wide remote-sensing datasets make this possible.

The NSW government agency Natural Resources Access Regulator (NRAR) enforces compliance to water laws throughout the state of NSW. This is important because without strict enforcement of quotas, some users may take more than their fair share. 

As a part of its proactive compliance monitoring campaigns, NRAR is using its ‘eyes in the sky’ program to scan and detect instances of potential non-compliance at the individual property level. Yet doing so over an area the size of France would be nearly impossible without remote sensing data products. Generating suitable date to enable property-level monitoring of water use is not a simple matter. Fortunately TERN, Australia’s Terrestrial Ecosystem Research Network, collects and provides such data to simplify access for other organisations and users.

To determine water usage in any particular location, NRAR starts with the amount of water falling as rain. The Bureau of Meteorology (BOM)  supplies this information. From this, they subtract the water that leaves the land surface as actual evaporation. Satellite images can determine this. Subtracting evaporation from rainfall yields the amount of water plants used for their growth. If water usage is more than rainfall, the difference will have been supplied by irrigation, or by deep-rooted plants accessing groundwater. So it is possible to determine the volume of irrigation at any location. This method sounds simple but is not.

New South Wales Water Map | Featured Image for NSW Water Authority Uses TERN Data to Track Property Water Use Blog by TERN.
Workflow stages in NRARs use of TERN AET data from top-right in a clockwise direction showing TERN AET data (Dec 2019), BoM rainfall (Dec 2019), AET minus RAIN, and a vegetation mask used to assist with irrigated area gridded and polygon data cleansing.

TERN data

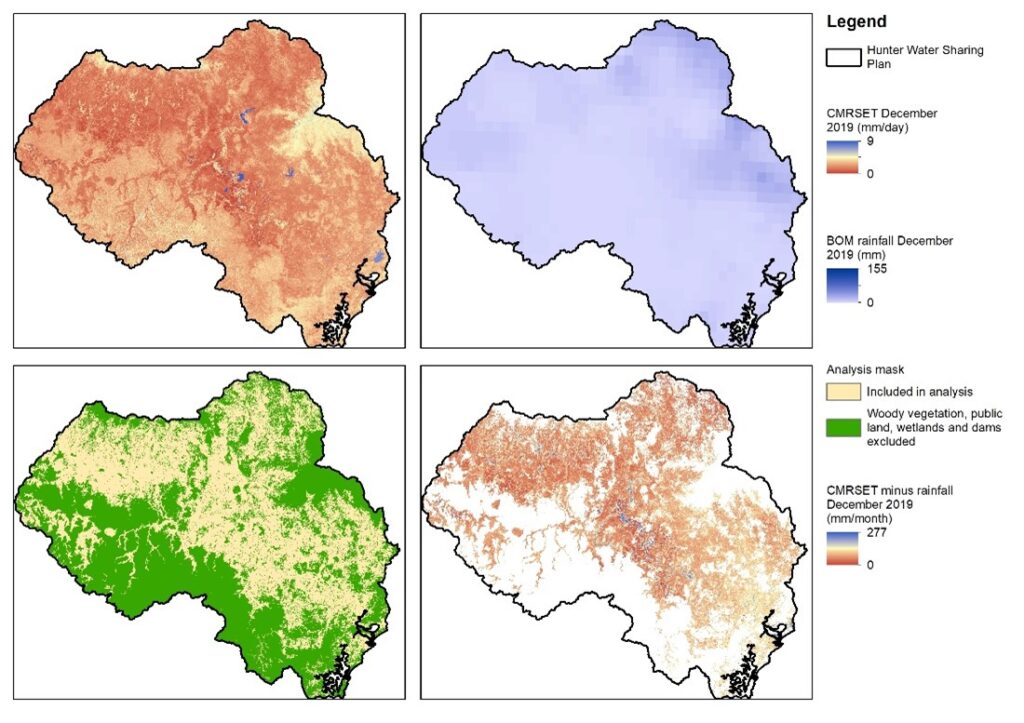
TERN collates and maintains a special data set for the whole of Australia called TERN Actual Evapo-Transpiration (AET). It includes data that evaporates from rivers and lakes, and directly from the soil, and importantly for NRAR’s application, the water plants suck out of the ground that evaporates through their leaves. All components of evaporation are estimated by satellite imagery to give a total evapotranspiration value for every part of Australia. In the TERN AET product, each pixel represents a 900msquare (each side is 30m long). At this scale, users can discern individual properties.  Images for all 7.7 million kmof Australia are available for every month since February 2000 and ongoing. For each month an AET value is provided for each of the 9.6 billion (9,573,266,811) 30 m resolution pixels in Australia.

Commonwealth Scientific and Industrial Research Organisation (CSIRO) Principal Research Scientist and Ecohydrological Time-Series Remote Sensing Team Leader Dr Tim McVicar manages TERN AET.

“We generate the data set by integrating satellite remote sensing data – from NASA, United States Geological Survey, and European Space Agency, mainly accessed via Google Earth Engine – with Bureau of Meteorology daily meteorological grids and TERN’s OzFlux tower data. There were over 141,000 Landsat scenes totalling over 75TB of satellite data processed on Google Earth Engine,” Dr McVicar said.

TERN also makes the AET data available to non-Google Earth Engine users.

In case of gaps in the Landsat series, caused for example by clouds, the TERN team uses Landsat-MODIS and Landsat-VIIRS blending to fill them. 

“This means users such as NRAR and others can work with gap-free, high-resolution, all-Australian, monthly data,” added Dr McVicar. “We’ve done the hard yards for them; the TERN AET data is ‘good to go’ for analysis at a paddock scale, anywhere in Australia.” 

For each month of the 23-year time-series (276 months) an AET value is provided for each of the 9.6billion (9,573,266,811) 30m resolution pixels in Australia.

The Bureau of Meteorology data consists of “rainfall decile maps”. We normally see information expressed as percentiles, or hundredths. In contrast, a decile is a data range split into tenths. Extreme rainfall events, such as those affecting eastern Australia during early 2022, fall into the highest decile (90-100 %). Extreme drought periods fall into the lowest (0-10 %). Rainfall decile maps feature rainfall extent colour-coded according to decile, superimposed on normal geographic maps.

New application

NRAR developed its own techniques for using the data. TERNs role was to undertake the enormous processing task to generate the AET data for all of Australia and answer questions about it that NRAR and numerous other data users have.  

The first trial of the new combination of techniques and data focused on the Hunter Valley region, near Newcastle. NRAR compared the results of the remote sensing analysis against its own database detailing water entitlements and metered water usage for every property in the region.

This allows excessive water users to be identified for follow-up contact. This includes users who may be taking surface water and groundwater volumes in excess of their entitlements and licence obligations.

This method will later be expanded to cover the whole state. NRAR’s eyes-in-the-sky approach will help guide its boots-on-the-ground inspections to ensure compliant water usage, so that each property owner takes its fair allocation, while also leaving water for downstream users and environmental river flows.

Aerial land map of rural New South Wales | Featured Image for NSW Water Authority Uses TERN Data to Track Property Water Use Blog by TERN.
The result of the TERN AET minus BoM gridded rainfall for December 2019 overlain with ‘cleaned' irrigated area polygons determined by spatially variable thresholding.
Aerial land map of rural New South Wales | Featured Image for NSW Water Authority Uses TERN Data to Track Property Water Use Blog by TERN.
‘Cleaned’ irrigated area polygons (in green) overlain over property boundaries aggregated by water licence holdings (in beige/tan/light brown).

Share Article